
By Kingtse C Mo and Dennis P Lettenmaier A brief synthesis presented by Josh Walston ATMS Seminar Spring 2017 Californias Central Valley Orville Lake California Humboldt River Nevada ID: 656921
Download Presentation The PPT/PDF document "Precipitation Deficit Flash Droughts ove..." is the property of its rightful owner. Permission is granted to download and print the materials on this web site for personal, non-commercial use only, and to display it on your personal computer provided you do not modify the materials and that you retain all copyright notices contained in the materials. By downloading content from our website, you accept the terms of this agreement.


Slide1
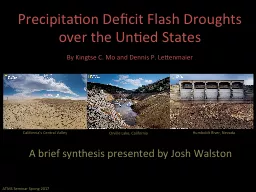
Precipitation Deficit Flash Droughts over the Untied StatesBy Kingtse C. Mo and Dennis P. Lettenmaier
A brief synthesis presented by Josh Walston
ATMS Seminar Spring 2017
California’s Central Valley
Orville Lake, California
Humboldt River, Nevada Slide2
OutlineFlash drought…? What the “heck” is flash drought?Why do we care?What drives them?
How can this happen?I must know…
Are they predictable? Is it time to summarize yet?
2 of 22
ATMS Seminar Spring 2017Slide3
First, What is Drought? There are different drought “types”
“Drought is a
persistent
and abnormal moisture deficiency having adverse impacts on vegetation, animals, or people.”- National Drought Policy Commission Report, 2000AKA the creeping disaster
3
of
22
ATMS Seminar Spring 2017
Sequence of drought occurrence and
impacts. Image credit:
National Drought Mitigation
Center.Slide4
Time Scales of Droughts
30
Days
Season
3Years
10
Years
30
Years
100Years
- Heat Wave-
Storm Track Variations
-
MJO
-
ENSO
-
Decadal Variability
-
Solar Variability
-
Meridional Overturning Circulation
-
Green House Gasses
ATMS Seminar Spring 2017
4
of
22
o
r less
Concept credit: UCAR, COMETSlide5
Flash Drought “…refers to rapid crop deteriation due to the the adverse effects of a severe heat wave and short-term dryness, leading to
rapid onset of drought and associated impacts in agriculture, fire potential, live-stock health, and other areas” - Svoboda et al., 2002; National Drought Mitigation Center
ATMS Seminar Spring 2017
5
of 22
Not
to be confused with Flash
Mob!
Wasn’t popularized until
2012
1)
Anomalous
high
pressure
2)
Declining soil moisture (SM)
Transitioned
into a more
conventional
droughtSlide6
MotivationRapid onset: No early warning for agricultural community
Increased fire potential
Economic losses: Reported in the billions.
ATMS Seminar Spring 2017
6
of 22
Withering corn field Texas
drought,
August 2013
. Image credit: Bob Nichols, USDA
El Portal
Fire,
Yosemite National
Park, July
2014
. Image credit
: Stuart
Palley
,
EPASlide7
Physical Mechanisms
ATMS Seminar Spring 2017
7
of 22
Several years after the first definition Mo and
Lettenmaier
defined 2 types of Flash Droughts:
Heat Wave Flash Drought
Temperature driven
Precipitation
indirect role
Atmospheric circulation support
Precipitation Deficit Flash Drought
**
Similar
**
Both
characterized by anomalous temperatures and SM
deficits
**
But Different
**
Maintained
by different physical mechanisms and have different characteristics.Slide8
Precipitation
Deficit
Precipitation
Deficit
Physical Mechanisms
ATMS Seminar Spring 2017
8
of 22
Several years after the first definition Mo and
Lettenmaier
defined 2 types of Flash Droughts:
Heat Wave Flash Drought
Temperature driven
Precipitation
indirect role
Atmospheric circulation support
Precipitation Deficit Flash Drought
Precipitation driven
Land-atmosphere interactionSlide9
Evolution of a Flash Drought
ATMS Seminar Spring 2017
9
of 22
Heat Wave Flash Drought:
Temperature driven. Slide10
Evolution of a Flash Drought
ATMS Seminar Spring 2017
10
of 22
Heat Wave Flash Drought:
Temperature driven.
High
temps
increasing ET
decreasing
SM
Requires p-deficit. Slide11
Evolution of a Flash Drought
ATMS Seminar Spring 2017
11
of 22
Heat Wave Flash Drought:
Synoptic setting
strengthening
aniticyclone
over Great Lake/Midwest. Slide12
Precipitation Deficit Flash Drought:Precipitation driven.Evolution of a Flash Drought
ATMS Seminar Spring 2017
12
of 22Slide13
Precipitation Deficit Flash Drought:Precipitation driven.P deficits=> decreasing SM=> decreasing ET => T increases.
Evolution of a Flash Drought
ATMS Seminar Spring 2017
13
of 22Slide14
Precipitation Deficit Flash Drought:Synoptic setting Strengthening anticyclone over southern Great Plains. Evolution of a Flash Drought
ATMS Seminar Spring 2017
14
of 22Slide15
Where are they most likely to occur
ATMS Seminar Spring 2017
15
of 22
Heat Wave Flash Drought
4-5% max
Midwest and Pacific Northwest states
.
Vegetation dense regionsSlide16
Where are they most likely to occur
ATMS Seminar Spring 2017
15
of 22
Precipitation Deficit Flash Drought
8-10% max
Anywhere
Great Plains and Southern states
most common.
Regions where land-atmosphere interaction is strongSlide17
Trends
ATMS Seminar Spring 2017
16
of 22
P-deficit flash droughts Increasing in SW
Probably not
trending
enough to be on Twitter though.Slide18
Trends
ATMS Seminar Spring 2017
16
of 22
Probably not
trending enough
to be on Twitter though.
Decreasing precipitationSlide19
Trends
ATMS Seminar Spring 2017
16
of 22
Warming trend in SW
Probably not
trending
enough to be on Twitter though.Slide20
Trends
ATMS Seminar Spring 2017
16
of 22
Probably not
trending
enough to be on Twitter though.
Midwest and Central Plains
Heat
wave flash droughts
decreasing
Precipitation increasing Slide21
Trends
ATMS Seminar Spring 2017
17 of
22
Probably not trending enough to be on
Twitter
though.
Heat Wave Flash Droughts on the decline over the Central U.S.
Number of heat wave flash drought per year over
(36-40N and 80-100W
) from 1916-2013.
Mo and
Lettenmaier
, 2015. “Heat Wave Flash Droughts in Decline” Slide22
Are they Predictable?
ATMS Seminar Spring 2017
18
of 22
Well, is any complex phenomena?
Vegetation Drought Response Index (
VegDRI
):
O
perational product.
S
atellite and climate data to map changes in
vegetation
.
S
easonal scale
Credit: National Drought Mitigation Center
Quick Drought Response Index (
QuickDRI
):
Complementary to
VegDRI
Includes
satellite ET
estimates
Sub
-seasonal
scale.
Soon
to be operational.
Credit: USGSSlide23
Credit: National Drought Mitigation Center
Are they Predictable?
ATMS Seminar Spring 2017
18
of 22
Well, is any complex phenomena?
Vegetation Drought Response Index (
VegDRI
):
O
perational product.
S
atellite and climate data to map changes in
vegetation
.
S
easonal scale
Quick Drought Response Index (
QuickDRI
):
Complementary to
VegDRI
Includes
satellite ET
estimates
Sub
-seasonal
scale.
Soon
to be operational.
Credit: USGSSlide24
Are they Predictable?
ATMS Seminar Spring 2017
19
of
22
Well, is any complex phenomena?
Evaporative
Demand Drought Index (EDDI
):
E
xperimental product.
Does
not
use precipitation
and soil
moisture.
Uses
air
temperature,
solar radiation, winds, and humidity
.
Not
sensitive to land-surface
type
Credit: Mike
Hobbins
CIRES-NOAA and Dan
McEvoy
DRI. Slide25
Are they Predictable?
ATMS Seminar Spring 2017
20
of 22
Well, is any complex phenomena?
Example of the EDDI drought
monitoring
tool:
F
lash
drought
development in
the Midwest in 2012.
5-week
intervals (
left
) compared to 2-week (right)
EDDI
captures the severe drought condition two months ahead of the USDM.
USDM
EDDI
Development of a flash drought in the Midwest in
2012
Image credit
: Mike
Hobbins
, CIRES–
NOAASlide26
Let’s Summarize
ATMS Seminar Spring 2017
21
of
22
A flash
d
rought is:
“
A
short-term, yet severe event, characterized by moisture deficits and abnormally high temperatures that negatively impact
vegetation.” (
Salnay
et al., 2008)
Take Home Message #1
Heat Wave Flash Drought
Results from
the confluence
of anomalously warm
T
air
a
nd low SM.
Occur in Midwest and Pacific Northwest during growing season (vegetation dense).
Precipitation Deficit Flash Drought
Results from a lack of precipitation, decreased Et and increased
T
air
.
Occur more than heat wave flash droughts (2x).
Most common in the Southern Great Plains and Southwest U.S. Slide27
Let’s Summarize
ATMS Seminar Spring 2017
21
of
22
A flash
d
rought is:
“
A
short-term, yet severe event, characterized by moisture deficits and abnormally high temperatures that negatively impact
vegetation.” (
Salnay
et al., 2008)
Take Home Message #2
Heat wave flash droughts have been
decreasing over the last century but rebounded
after 2011. While precipitation flash droughts increasing in the Southwest. Slide28
Let’s Summarize
ATMS Seminar Spring 2017
21
of
22
A flash
d
rought is:
“
A
short-term, yet severe event, characterized by moisture deficits and abnormally high temperatures that negatively impact
vegetation.” (
Salnay
et al., 2008)
Take
Home Message
#3
Operational and experimental tools are being deployed to monitor flash droughts, with EDDI appearing
to
provide the most advanced
notice of drought development, often ahead of other commonly used indexes.Slide29
ReferencesPrecipitation driven Land-atmosphere interaction
Brown, J. F., 2016:
QuickDRI
: A New Tool in the Remote Sensing Toolbox for Drought Monitoring. DOI Remote Sensing Activities 2016.Hobbins, M. T., A. Wood, D. J. McEvoy, J. L. Huntington, C. Morton, and J. Verdin, 2016: The Evaporative Demand Drought Index. Part I: Linking drought evolution to variations in evaporative demand. J. Hydrometeor., 17, 1745–1761, doi:10.1175/JHD-15-0121.1.
McEvoy, D. J., J. L. Huntington, M. T.
Hobbins, A. Wood
, C. Morton, J. Verdin, M. Anderson, and C.
Hain, 2016a: The Evaporative Demand Drought Index. Part II: CONUS-
wide assessment against common drought indicators. J. Hydrometeor.,
17, 1763–1779, doi:10.1175/JHM-D-15-0122.1.
Mo, K.C., and D. P. Lettenmaier, 2016: Deficit Flash Drought over the the United States. J. Hydrometeor., 17
, 1169—1184.
DOI: 10.1175/JHM-D-15-
0158.1
Mo
, K. C., and D. P.
Lettenmaier
, 2015: Heat
Wave
F
lash
D
roughts
in
Decline
.
Geophys
. Res. Lett., 42, 2823–2829, DOI:10.1002/2015GL064018.Senay, G. B., M. B. Budde, T. F. Brown, and J. P. Verdin, 2008: Mapping drought in the Southern Great Plains. 22nd Conf.
on Hydrology
, New Orleans, LA, Amer. Meteor. Soc.,
6.8
Svoboda
, M., and Coauthors, 2002: The Drought Monitor. Bull.
Amer.
Meteor
. Soc., 83, 1181–1190, doi:10.1175/1520-0477(2002)083,1181
:
TDM
.2.3.CO;2
.
Understanding
Drought
. COMET®
Website
at http://
meted.ucar.edu
/
of
the University Corporation for Atmospheric Research (UCAR), sponsored in part through cooperative agreement(s) with the National Oceanic and Atmospheric Administration (NOAA), U.S. Department of Commerce (DOC) ©1997-2010 University Corporation for
Atmospheric Research. All Rights Reserved.
Wardolow, B.D., J.F. Brown, T. Tadesse, K. Callahan
, C. Poulsen, D. Howard. 2013: Vegetation Drought
Response Index (VegDRI
), A Hybrid-
B
ased
Agricultural
D
rought
Monitoring
Tool
for
the
Continental United States. Symposium
of
Remote
Sensing
for
the
Crop and
Pasture
Statistics
. ASA
Sectiion
:
Climatology
and
Modeling
. Tampa, FL.Slide30
Questions?
ATMS Seminar Spring 2017