
When taking scientific measurements the goals are to measure accurately and with precision Accuracy refers to how close a measured value is to the actual or real value Precision ID: 645672
Download Presentation The PPT/PDF document "Significant Figures Accuracy versus Prec..." is the property of its rightful owner. Permission is granted to download and print the materials on this web site for personal, non-commercial use only, and to display it on your personal computer provided you do not modify the materials and that you retain all copyright notices contained in the materials. By downloading content from our website, you accept the terms of this agreement.


Slide1
Significant FiguresSlide2
Accuracy versus Precision
When taking scientific measurements, the goals are to measure
accurately
and with
precision
.
Accuracy
refers to how close a measured value is to the actual or real
value
Precision
refers to how close the measurements are to one anotherSlide3
Accuracy versus Precision
Accuracy
refers to how close a measured value is to the actual or real value
Precision
refers to how close the measurements are to one another
Examine the diagrams on the right. Which displays accuracy? Precision? Assume the bull’s-eye represents the true value
Neither
Precision
Accuracy
Accuracy and PrecisionSlide4
Measuring Tools
In order to take measurements, scientists must use a measuring
tool
Ruler
Scale
SpectrometerBarometerEtc.
Each device has a maximum level of precision that it can measure. Slide5
Measuring Tools
Eg
. Which of the following best describes the length of the red rectangle?
A. 2 cm B. 2.3 cm C. 2.34 cm D. 2.342 cmSlide6
Measuring Tools
The smallest division this ruler shows is millimeters (0.1 cm), however, we are able to
estimate
up to a tenth of a millimeter (0.01cm).
In general, a measurement includes:
The smallest marked interval on the toolEg
. Millimeters on a rulerOne more estimated decimal placeEg. Tenths of a millimeter on a rulerThe number of digits or decimal places in a measurement represents our certainty, or to what degree we are confident that our measurement represents the true value.Slide7
Measurements
The number of digits and decimal places in a measurement represents our certainty, or to what degree we are confident that our measurement represents the true value.
This is referred to as the number of
significant figures
Significant figures
(sig figs): the digits that contribute meaning to a measurementSlide8
Significant Figures include:
All non-zero digits
Eg
. 3.4 has 2 significant figures
All zeros between non-zero digits Eg
. 3.04 has 3 significant figuresAll zeros trailing non-zero digits after a decimal place Eg. 3.0400 has 5 significant figuresSlide9
Significant Figures D
o
N
ot Include:
Any leading zeros
Eg. 0.002 has 1 significant figureAny trailing zeros necessary to denote scale UNLESS they are followed by a decimal point
Eg. 10,000 has 1 significant figure 10,000. has 5 significant figuresSlide10
Significant Figures
In general: ask yourself “is this zero necessary or did we go out of our way to include it?”
If it is necessary, it is
not
significant
If we went out of our way to include it, it is significant
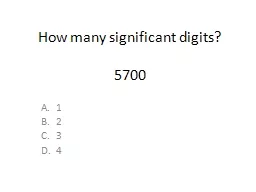
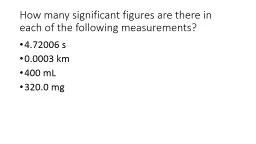
How many significant figures?0.02
1 6. 5005710. 70.002
1 7. 5005710 61.002 4 8. 1.7 x
21.0020
5 9. 1.07 x
3
5005710.0
8
10. 1.70 x
3
NOTE:
With proper scientific notation, all the digits at the front are significant
Slide11
Operations with Significant Figures
Significant figures must also be tracked when performing operations on measurements.
We can’t be more confident of an output than we were of the input.
Adding and subtracting: the sum or difference should be rounded to the same number of
decimal places
as the input with the fewest number of decimal places
Eg. 21.1 + 37.02 = 58.12
Our answer needs to be rounded to 58.1 (one decimal place)Multiplying and dividing: the product or quotient should be rounded to the same number of
sig figs as the input with the fewest number of sig figsEg. 2.01 * 47 = 94.47 Our answer needs to be rounded to 95 (two sig figs)