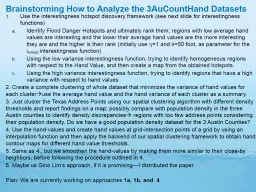
Use the interestingness hotspot discovery framework see next slide for interestingness functions Identify Flood Danger Hotspots and ultimately rank them regions with low average hand values are interesting and the lower their average hand values are the more interesting they are and the higher ID: 697298
Download Presentation The PPT/PDF document "Brainstorming How to Analyze the 3AuCoun..." is the property of its rightful owner. Permission is granted to download and print the materials on this web site for personal, non-commercial use only, and to display it on your personal computer provided you do not modify the materials and that you retain all copyright notices contained in the materials. By downloading content from our website, you accept the terms of this agreement.