
NotestendencyforHSHtobemostfrequentlyfoundintheNearcticandPalearcticregionswhichcomplicatedinterpretationNonethelesswhereasHSHrepresentedoutofthetotalPalearcticNearctictakentogetherSRArelationshipsi ID: 869045
Download Pdf The PPT/PDF document "9212011pp2532602011bytheEcologicalSociet..." is the property of its rightful owner. Permission is granted to download and print the materials on this web site for personal, non-commercial use only, and to display it on your personal computer provided you do not modify the materials and that you retain all copyright notices contained in the materials. By downloading content from our website, you accept the terms of this agreement.

1 Notes ,92(1),2011,pp.253 2602011bytheEco,2011,pp.253
2602011bytheEco")
Notes ,92(1),2011,pp.253 2602011bytheEcologicalSocietyofAmericaQualityofbasicdataandmethodtoidentifyshapeaffectrichnessaltituderelationshipsinmeta-analysis tendencyforH-SHtobemostfrequentlyfoundintheNearcticandPalearcticregions,whichcomplicatedinterpretation.Nonetheless,whereasH-SHrepresentedoutofthetotalPalearcticNearctic(takentogether)SRArelationshipsinthewholedataset,itsrepresentationroseto77inthestringentsubset.Also,theproportionalrepresentationofNearticregionsincreasedbyafactorof1.25inthestringentsubset,whereastheproportionalrepresentationofH-SHpatternsincreasedbyafactorof3.Thus,inspiteofthebiogeographicassociation,thesubstantialchangeintheproportionalrepresentationofdifferentshapesshowninthestringentsubsetcanbehardlyconsideredasmerelytheconsequenceofthepresenceofNearcticandPalearcticSRArelationships.OneeffectofrelaxingtheselectioncriteriaofinclusionofSRArelationships,fromstringenttointermediateandlax,wastoincreasetheproportionalrepresentationofmonotonicdecreasingpatterns.Thissuggestedthatreducingthesamplingeffortinindivid-ualstudies,i.e.,eitherbyloweringthenumberofsamplingpoints,orbyreducingtheproportionofthegradientsampled,mayfavortheperceptionofmono-tonicdecreasingpatterns,andthiscouldaltertherelativedistributionofdifferentSRApatterns.Varia-tioninsamplingefforthasbeenpreviouslyfoundtoaffectothermacroecologicalrelationships(e.g.,bodysize abundancerelationships;Grifths1998).Exam-inedwithinthecontextofSRArelationships,thereductionofthenumberofsamplingpoints,ortheproportionofgradientsampled,maybeassociatedwitheffectsofspatialscaleknowntoaffecttheanalysisofspeciesdiversitypatterns(LyonsandWillig1999,2002,RahbekandGraves2000,Whittakeretal.2001),andspecically,ofaltitudinalrichnessgradients(e.g.,Rahbek2005,JankowskiandWeyhenmeyer2006,Nogues-Bravoetal.2008,Sandersetal.2009).Weshowedthehigherfrequencyofoccurrenceofhump-shapedpatternsinthestringentsubsetofdata,whichencompassedstudiesthatinvolvedgreatersamplingeffort,andspannedoverlongeraltitudinalextentsthantheintermediateandlaxsubsets.Ontheotherhand,allhump-shapedpatternsinthestringentsubsetcameupfromstudiesperformedatlandscapescalewithinthePalearcticandNearcticregions.Giventhelownumberofobservationsinourstringentdataset,alltheseeffectsdeservefurtherattentioninfuturestudies.Anotherconsequenceofourdatamanipulationwasincreasinguncertaintyintheidenticationofpatternusingtheintermediateandlaxsubsetsofdata,andalso,aftercontrollingfordifferencesinsamplesize,uncer-taintyoverestimationofthemagnitudeofSRArelationshipsincreasedwiththerelaxationofcriteriaofinclusionofdata.Theoccurrenceofnopattern(NP)wasgreaterintheintermediateandlaxsubsetsofdataratherthaninthestringentsubset,especiallyforthestatisticalmethod.Forthelaxandintermediatesubsets,thestatisticalmethodwasmoreconservativeinthedetectionofpattern,andsuggestedahigherproportionofNPratherthanthevisualmethod.ThevisualmethodandtheconsensushelpedinsortingoutNPdatasetsintorecognizableshapes;however,aconsiderableproportionofdatasetssuggestingnopatternorcontradictoryinformationremained.Thestringentsubsethadlessaverageinter-siteresolution,whichimpliesthatagreatereffectofspatialautocor-relationinthisdatasetmightcontributetodecreaseuncertaintyaboutdetectionofshape.Thereareanumberofattributesinthedesignofstudiesthatcomposedtheintermediateandlaxsubsetsthatmaycomplicatethedetectionofp
2 attern,includinglessand/orunstandardized
attern,includinglessand/orunstandardizedsamplingeffort,andincreasedinter-siteresolutionthatpromotesanincreaseinthescatteringofdata.However,aproportion()ofdatasetsinthestringentsubsetalsoshowednopattern.ThissuggeststhatthepresenceofidiosyncraticvariationintheSRArelationshipsmightberathercommoninarthropods.OurstudyshowedthattheuseofdifferentmethodstoidentifySRAshapesindeedinteractswiththequalityofbasicdatatoinuencetherelativedistributionofpatterns.OnlythestringentsubsetofdatarevealedaconsistentorderintherelativeimportanceofdifferentSRAshapesthatwasrobusttovariationinmethodofanalysis.ToofewSRArelationshipsremainedinthestringentsubsetastoinfergeneralconclusionsontheextremelyhighlydiversearthropods.However,theconsistencyintheoutcomeinthestringentsubsetmakesreasonabletoinfertheexistenceofmultipleSRAforms,withthepredominanceofhump-shapedpatternsovermonotonicdecreasingones,alongwiththepresenceofconsiderableidiosyncraticvariation.Hadwebasedourinterpretationonthewholedatasetthiswouldhaveledtoadifferentconclusionaboutthepredominantpatternsinarthropods.WeconcludethatdecisionsfollowedtogatherthedataandthemethodweusetoinferSRArelationships(visuallyorstatistically)bothmayinuenceourperceptionoftherelativefrequencyofpredominantshapes,andnotnecessarilythelargestdatasetisthebestformeta-analysis.J.Gurevitch,K,MergensenandJ.M.Moralesgaveususefulstatisticaladvice.A.F.SilberingandR.J.Whittakercontributedusefulbibliographies.D.J.Currieprovidedinsightfulcomments.V.WerenkrautandA.RuggieroaresupportedbyCONICET(PIP5113)andUniversidadNacionaldelComahue.ITERATUREBrown,J.H.,andM.V.Lomolino.1998.Biogeography.Secondedition.Sinauer,Sunderland,Massachusetts,USA.Burnham,K.P.,andD.R.Anderson.2002.Modelselectionandmultimodelinference.Secondedition.Springer,NewYork,NewYork,USA. January2011 R ESULTS Thetotalof109SRArelationshipstakentogether showeddifferencesintheproportionalrepresentationof differentformsbetweenthetwomethodsofanalysis, andconsensus(Fig.1a c).Thestatisticalmethod suggestedlackofpatternin ; 40 % ofthedatasets (NP;Fig.1a).DECandL-PLhadasimilar( ; 20 % ) proportionalrepresentation,followedbyH-SH( ; 13) (Fig.1a).Thevisualmethodhalf-decreasedthepropor- tionalrepresentationofNPandL-PL,andincreased considerablytheproportionalrepresentationofH-SH andDEC(Fig.1b).TheconsensussuggestedDECwas themostabundantSRArelationship,followedbyH- SH,andL-PLbecamerarer; ; 20 % outofthetotaldata setsremainedasNP,and ; 25 % showednoconsensus (CONT;Fig.1c). F IG .1.RelativefrequencydistributionsofSRA(speciesrichness altitude)patternsobservedinsubsetsoftheworldwide arthropoddata:(a c)wholedataset;(d f)stringentsubset;(g i)intermediatesubset;and(j l)laxsubset.Thepatternswere analyzedbystatisticalandvisualmethodsandbyconsensus.Abbreviationsare:H-SH,hump-shaped;DEC,monotonicdecreasing; L-PL,low-plateau;INC,monotonicincreasing;U-SH,U-shaped;NP,nopattern;OTH,otherpatterns;andCONT,contradictory. Numbersabovebarsaresamplesizes.Studieswithalownumberofsamplingpoints( N ¼ 5)werenotanalyzedbythestatistical method. January2011 257 NOTES patternthathasarichnesspeakatintermediatealtitudes with25 % ormorespeciesthanatthebaseortopofthe mountain(i.e.,thesocalledmid-elevationpeakby McCain2009).AL-PLpatternhad . 300mof consecutivelyhighrichnessatthemountainbaseand thereafterdecreasingspeciesrichness(seeMcCain2009 forfurtherdeta
3 ilsandotherpossibleforms).Datasets thats.Datasets
thats")
ilsandotherpossibleforms).Datasets thatsuggestednoclearSRArelationshipwereassigned toNP,andotherdifferentformswereincludedinOTH. Welookedforaconsensusbetweenthevisualand statisticalmethodstoidentifythenalshapeofeach dataset;datasetsshowinglackofconsensuswere labeledascontradictory(CONT). Tofurtherevaluateuncertaintyoveridenticationof shape,wesquareroot-transformedthecoefcientsof determination( R 2 )fromtheordinaryleastsquares (OLS)regressionstoobtaincorrelationcoefcients( r ) (e.g.Hillebrand2004),whichweretransformedtoan effectsize( z r ,Fishers z -transformation;Hedgesand Olkin1985).Weestimatedacommonmeasureofeffect sizeforthestringent,intermediate,andlaxsubsetsof data,takingintoaccountthatthenonsystematic varianceofestimatesofeffectsizewasinversely proportionaltothesamplesizeofthegradientson whichestimateswerebased(HedgesandOlkin1985). Combinationoflinearandquadratictermsinmeta- analysisrequiresthatallthestudy-specicregressions havebeenttedwiththesamenumberofterms(K. MergensenandJ.Gurevitch, personalcommunication ). Hence,weconductedthisanalysisseparatelyforeach SRApattern(H-SH,DEC,andL-PL).Weperformed alltheanalysesusingRsoftware(RDevelopmentCore Team2009). Closeexaminationofpatternsinourwholedataset, afterconsensus,showedthat,althoughtherelative frequencyofthemostabundantpatterns(H-SH, DEC,L-PL)wasindependentoftaxonomy(permuta- tion-basedFisher-FreemanHaltontestforsmall-sample categoricaldata[FI] ¼ 20.16,df ¼ 18, P ¼ 0.19),there wasanassociationwithclimate(FI ¼ 30.87,df ¼ 24, P ¼ 0.02),andbiogeography(FI ¼ 23.03,df ¼ 12, P ¼ 0.003) (seealsoAppendixB:Fig.B1).Wetestedthese associationsinthethreesubsetsofdatatoelucidate theextenttowhichtaxonomy,climate,andbiogeogra- phymightinuencechangesintherelativeproportions ofSRApatternsafterourdatamanipulation.These analyseswereconductedusingStatXact-6(2003). P LATE 1.PanoramicviewofatemperatemountainregioninnorthernPatagonia,showinganexampleofthekindof environmentalchangesthatoccurwithaltitude.Photocredit:V.Werenkraut. NOTES 256 Ecology,Vol.92,No.1 toinuencetheSRApatterns(Rahbek2005).(3)Numberofsamplingpoints.Whittaker(2010)adopteda10-datapointminimumassuitabletodiscriminatebetweenlinearandunimodalforminthespeciesrichness productivityrelationship.(4)WerecordedthepresenceofanthropogenicdisturbanceasapotentialconfoundingvariableoftheSRArelation-ship.Whittaker(2010)arguedthatthestudydesignshouldnotinvolvepotentialconfoundingvariablesofthetestedecologicalrelationship.Weassignedeachgradienttoadifferentsubsetofdataaccordingtothefollowingcriteria:(1)stringent(ofthegradientsampled,standardizedorequalsamplingeffortacrossdifferentaltitudes,and10samplingpoints);(2)intermediate(standardizedorequalsam-plingeffortalongwithoneoftwootherpossibleconditions[eithertheproportionofgradientsampledandthenumberofsamplingpointswasorthenumberofsamplingpointswas10,buttheproportionofgradientsampledwas]);and(3)lax(studiesthatinvolvedunstandardizedorunequalsamplingeffortacrossdifferentaltitudesand/orshowedevidenceofanthropogenicdisturbanceasapotentialconfoundingvariable;ifstandardizedsamplingeffortwasapplied,thentheyhad10samplingpointsandofgradientsampled).Mostofthestudiesincludedinouranalysiswereeldstudiesthatsampledarthropodsatverylocalgrainsizesusingdifferentsamplingmethods;therewereonlyafewstudiesthatusedcollectiondatafrommuseumsordist
4 ributionalinformationfrommaps(seeAppendi
ributionalinformationfrommaps(seeAppendixA:TableA1).Afterclassicationofstudiesintothethreesubsets,weconrmedthatthestringentsubsetofdataencompassedgradientsof760mofmeanaltitudeextent(meanSD)and45mofmeaninter-siteresolution(i.e.,meandistancebetweensam-plingpoints),withagreaterproportionofstudiesatthelandscapescale(i.e.,lineardistancebetweenthetwomostextremepoints30km)ratherthanatlocalscales(i.e.,distancebetweenthetwomostextremepointskm):62vs.38,respectively.Theintermediatesubsetofdataencompassedgradientsof668mofmeanaltitudeextent,134mofmeaninter-siteresolution,andagreaterpercentageofstudiesatlocal)thanatlandscapescale(29).Thelaxsubsetofdataencompassedgradientsof808mofmeanaltitudeextent,137mofmeaninter-siteresolution,andsimilarpercentageofstudiesatland-scapeandlocalscale.IdenticationofpatternsWeanalyzed109altituderichnessgradientsbytwomethods:(1)astandardprotocolthatallowedthestatisticaldescriptionofpattern(hereafterreferredasstatisticalmethod)and(2)visualexaminationofshape(visualmethod).Ourpurposeherewasprimarydescriptive,andweusedstandardstatisticalorvisualmethodstoaccountfortheshapeofaltitudinalrichnessgradients(e.g.,RoweandLidgard2009forasimilarStatisticalmethod.Foreachdataset,weregresseddataofrichness()onaltitude()toevaluatethelikelihoodofthedatagivenfourdifferentmodels.Model1:asimplelinearSRArelationship(istheinterceptandistheslope)thatdescribedamonotonicdecreasing(DEC)orincreasingpattern(INC),dependingonthesignoftheslope.Model2:anonlinearSRArelationshipoftheformwhichdescribedalow-plateaupattern(L-PL;ratherconstanthighrichnessatlowaltitudesfollowedbyadecreaseinrichness)when0.Model3:oftheform,withistheintercept,andregressioncoefcients,which,dependinguponthesigncoefcient,describedahump-shapedpattern(H-0),orU-shapedpattern(U-SH;0).Model4:theonly-interceptmodel()thatevaluatedthelackofaltitudinalpattern(NP).ForeachdatasetassignedtoH-SH,wefurthercheckedthatthemaximumrichnessfellwithintherangeofaltitudesencompassedbythedata.ThestatisticalmethodallowedthedetectionofotherformsintheSRArelationship(e.g.,J-shapedorL-shapedpatterns)thatwemaintainedinasinglecategory(OTH).Tondthebestexplanatorymodel,i.e.,forassign-mentofeachdatasettoadifferentpattern,weusedtheAkaikesinformationcriterioncorrectedforsmallsamples(AIC;BurnhamandAnderson2002,Diniz-Filhoetal.2008),whichallowedorderingthefourmodelsttedtoeachdatasetfrombesttoworst.WeconsideredthemodelhavingtheminimumAICasthebestmodelsupportedbythedata.Weestimatedthesizeoftheincrementsofinformationloss()foreachmodelcomparedtotheestimatedbestmodel();modelshaving2ofthebestmodelwereconsideredtohaveconsiderablelesssupport(BurnhamandAnderson2002,Diniz-Filhoetal.2008).Modelsthathada2ofthebestmodelwereconsideredequallylikelyforaparticulardataset;inthiscase,weassignedsupporttoeachSRApatterninvolved,inequalproportions,dividing1bythetotalnumberofSRApatternssupported.Visualmethod.Foreachdataset,weelaboratedascatterplotofthevariationofrichnessasafunctionofaltitudeforvisualidenticationofshape:monotonicdecreasing(DEC),monotonicincreasing(INC),hump-shaped(H-SH),U-shaped(U-SH),andlow-plateau(L-PL).Tominimizetheinherentsubjectivityofthismethod,wefollowedMcCain(2009)scriteriaforassignmentofSRArelationshipsintodifferentpatterns.WedenedDECandINCasthosepatternsinwhichspeciesrichness,respectively,declinedorincreasedmonotonicallywithelev
5 ation.H-SHwasaunimodal January2011 shape
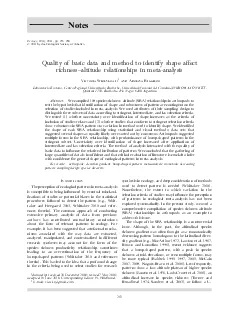
ation.H-SHwasaunimodal January2011 shape(Ribeiroetal.1998).SuchmultipleformsintheSRArelationshipquestiontheuniversalityofthealtitudinaldiversitygradient.Here,wecompiledSRArelationshipsfromdifferentpartsoftheworldtotestthehypothesisthatidenticationofSRApatternsdependsuponthequalityoforiginalstudiesincludedinmeta-analysisandthemethodusedtoidentifyshape.Wetestedthepredictionsthat(1)uncertaintyoveridenti-cationofshapeincreasesasthecriteriausedtoincludeastudyintotheanalysisbecomesmorelax,and(2)studiesthatconformtostringentselectioncriteriashowrobustaltitudinalrichnesspatternswithrespecttovariationinmethodusedtoidentifyshape.Theselectionofpublishedstudiesusedtocreatedifferentsubsetsofdatahasbeenusefultoexaminetheeffectsofscale,sampling,andarealstandardizationonSRApatterns(Rahbek2005).OurstudywillshowthattheuseofdifferentmethodstoidentifySRAshapesinteractswiththequalityofbasicdatatoinuencetherelativedistributionofpatterns.Acaveatisneededabouttheapproachadoptedinthepresentstudy,whichuseddatafrommountainsindifferentpartsoftheworldtocomparetherelativefrequencyofSRApatterns,butwithoutdisentanglingtheroleofdifferentenvironmentaldriversonshape.Datacollectedalongaltitudinalgradientsreectthecombinedeffectofgeneralclimaticandgeophysicalchangeswithaltitudeandregionalphenomena(e.g.,historyandisolationofmountainbiota;seePlate1);hence,ithasbeensuggestedthatthelackofastandardmountaincomplicatestheinterpretationofdiscrepancybetweenndingsfromdifferentaltitudinalgradientsbydifferentresearchersifonlyaltitudeistakenintoaccountasexplanatoryvariable(Korner2007).None-theless,throughoutthepresentstudyaltitudewasnotconsideredthedrivingfactorforspeciesrichness,butjustthetemplateforourmeta-analysis.Ourpurposeherewastoevaluatetheextenttowhichdecisionstakenbyresearchersatthetimeofdatacompilationandassignmentofgradientstodifferentshapesmaycomplicatedetectionofrobustpatternsinmeta-analysis;condenceintheidenticationofshapeisneededbeforeanyattempttoidentifyunderlyingdriversofSRArelationshipsismade.SelectionofdataWecarriedoutaliteraturesearchthroughZoologicalRecordandScopus(availableonlineWeusedaltitud*orelevation*richnessordiversityaskeywords.Asterisksareusedtosubstituteforanyothercharacterorcharactersinthesearchstring.Forinstance,searchtermssuchasaltitud*wouldreturnanywordthatbeginswithaltitud,suchasaltitudeandaltitudinal.Wesearchedforpaperswithanyofthersttwowords[altitud*orelevation*]anyofthesecondtwowords[richnessordiversity].Additionalpaperswereobtainedbyexaminingthereferencesoforiginalarticles.Weselectedallpapersthatreporteddataontherichnessofarthropodspeciesforatleastvedifferentelevations.Toreducetheso-calledledrawerprob-lem(Rosenthal1979,Csadaetal.1996),weselectedstudiesthatwereoriginallydesignedtotesttheSRArelationshipalongwithothersthatwerenotspecicallydesignedforthispurpose.Weincludedgradientsprovidedtheyreporteddataonrawspeciesrichness(neitherrareednortransformed)foreachaltitude.Forafewstudieswheredataonrichnesswerenotavailable,weestimatedlocalrichnessateachaltitudebasedonconrmed(i.e.,notinterpolated)presenceofspecies.Toovercometheproblemofpseudo-replication,weselectedpapersfromthesameauthor/sprovidedtheyworkedwithdifferentdatasets,andweanalyzedrichnessdatafromdifferentyearsinthesamelocationonlyiftheywerefromdifferentsamplingpoints.Whenastudycombineddataonlocalric
6 hnessestimationsfromseveralmountainstode
hnessestimationsfromseveralmountainstodescribearegionalaltitude richnessrelationship,weselecteddataonthelocalaltitudinalgradientsanddiscardedvaluesatregionalscale.Whenastudyreportedrichness altitudedataofsubordinatetaxa(e.g.,subfamilies)withinahighertaxonomiclevel(e.g.,family),weseparatelyanalyzedthedataoneachsubordinatetaxonanddiscardedthevaluesreportedathighertaxonomiclevel.Ourselectionprocessresultedinaworkinglistof75studieswithaltitude richnessdataon109altitudinalgradients(seeAppendixA).DataonlypublishedingraphicformweredigitizedusingDataThiefII1.1.0(Tummers2006;availableonlineOurlastsearchwasinDecember2007,andpaperspublishedsincethenwerenotincludedinourstudy.CriteriausedtoclassifygradientsintodifferentsubsetsofdataWeclassiedeachaltitudinalgradientwithrespecttofourvariablesthatallowedtheirsubsequentinclusionintodifferentsubsetsofdata(seeAppendixA:TableA1).Foreachstudy,werecordedthreefactorsinvolvingsamplingdesign(points1 3)andoneinvolvingtheimpactsofhumanpresence(point4):(1)Proportionofgradientsampled.McCain(2009)proposedthatanalysisofSRArelationshipsshouldbebasedonstudiesthatcoveratleast70ofthetotalmountainrange.(2)Samplingstandardization.Werecordedthepresenceofstandardizedorequalsam-plingeffortacrossdifferentaltitudes,whichareknownhttp://thomsonreuters.com/products_services/science/science_products/a-z/zoological_recordhttp://www.scopus.com/home.urlhttp://datathief.org/ Ecology,Vol.92,No.1 Csada,R.,P.James,andR.Espie.1996.Theledrawerproblemofnon-signicantresults:doesitapplytobiologicalresearch?Oikos76:591 593.Diniz-Filho,J.A.F.,T.F.L.V.B.Rangel,andL.M.Bini.2008.Modelselectionandinformationtheoryingeograph-icalecology.GlobalEcologyandBiogeography17:479 488.Grifths,D.1998.Samplingeffort,regressionmethod,andtheshapeandslopeofsize-abundancerelations.JournalofAnimalEcology67:795 804.Hedges,L.V.,andI.Olkin.1985.Statisticalmethodsformeta-analysis.AcademicPress,NewYork,NewYork,USA.Hillebrand,H.2004.Onthegeneralityofthelatitudinaldiversitygradient.TheAmericanNaturalist163:192 211.Jankowski,T.,andG.A.Weyhenmeyer.2006.Theroleofspatialscaleandareaindeterminingrichness-altitudegradientsinSwedishlakephytoplanktoncommunities.Oikos115:433 442.Janzen,D.H.,M.Ataroff,M.Farinas,S.Reyes,N.Rincon,A.Soler,P.Soriano,andM.Vera.1976.ChangesinthearthropodcommunityalonganelevationaltransectintheVenezuelanAndes.Biotropica8:193 203.rner,C.2007.Theuseofaltitudeinecologicalresearch.TrendsinEcologyandEvolution22:569 574.Lawton,J.H.,M.MacGarvin,andP.A.Heads.1987.EffectsofaltitudeontheabundanceandspeciesrichnessofinsectherbivoresonBracken.JournalofAnimalEcology56:147 Lods-Crozet,B.,E.Castella,D.Cambin,C.Ilg,S.Knispel,andH.Mayor-Simeant.2001.MacroinvertebratecommunitystructureinrelationtoenvironmentalvariablesinaSwissglacialstream.FreshwaterBiology46:1641 1661.Lyons,S.K.,andM.R.Willig.1999.Ahemisphericassessmentofscale-dependenceinlatitudinalgradientsofspeciesrichness.Ecology80:2483 2491.Lyons,S.K.,andM.R.Willig.2002.Speciesrichness,latitude,andscale-sensitivity.Ecology83:47 58.MacArthur,R.H.1972.Geographicalecology.HarperandRowe,NewYork,NewYork,USA.McCain,C.M.2007.Couldtemperatureandwateravailabilitydriveelevationalspeciesrichnesspatterns?Aglobalcasestudyforbats.GlobalEcologyandBiogeography16:1 13.McCain,C.M.2009.Globalanalysisofbirdelevationaldiversity.GlobalEcologyandBiogeography18
7 :346 360.s-Bravo,D.,M.B.Araujo,T.S.Romda
:346 360.s-Bravo,D.,M.B.Araujo,T.S.Romdal,andC.Rahbek.2008.Scaleeffectsandhumanimpactontheelevationalspeciesrichnessgradients.Nature453:216 219.RDevelopmentCoreTeam.2009.R:alanguageandenvironmentforstatisticalcomputing.RFoundationforStatisticalComputing,Vienna,Austria.http://www.Rahbek,C.1995.Theelevationalgradientofspeciesrichness:auniformpattern?Ecography18:200 205.Rahbek,C.1997.Therelationshipamongarea,elevation,andregionalspeciesrichnessinneotropicalbirds.TheAmericanNaturalist149:875 902.Rahbek,C.2005.Therolofspatialscaleandtheperceptionoflarge-scalespecies-richnesspatterns.EcologyLetters8:224 Rahbek,C.,andG.R.Graves.2000.Detectionofmacro-ecologicalpatternsinSouthAmericanhummingbirdsisaffectedbyspatialscale.ProceedingsoftheRoyalSocietyofLondonB267:2259 2265.Ribeiro,S.P.,M.A.A.Carneiro,andG.W.Fernandes.1998.Free-feedinginsectherbivoresalongenvironmentalgradientsinSerradoCipo:basisforamanagementplan.JournalofInsectConservation2:107 118.Rosenthal,R.1979.Theledrawerproblemandtolerancefornullresults.PsychologicalBulletin86:638 641.Rowe,R.J.,andS.Lidgard.2009.Elevationalgradientsandspeciesrichness:domethodschangepatternperception?GlobalEcologyandBiogeography18:163 177.Sanders,N.J.,R.R.Dunn,M.C.Fitzpatrick,C.E.Carlton,M.R.Pogue,C.R.Parker,andT.R.Simons.2009.Adiversityofelevationaldiversitygradients.Pages75 87rnerandE.Spehn,editors.Dataminingforglobaltrendsinmountainbiodiversity.CRCPress,BocaRaton,Florida,Sanders,N.J.,J.Moss,andD.Wagner.2003.Patternsofantspeciesrichnessalongelevationalgradientsinanaridecosystem.GlobalEcologyandBiogeography12:93 102.StatXact-6.2003.Astatisticalpackageforexactnonparametricinference.CytelSoftwareCorporation,Cambridge,Massa-chusetts,USA.Turner,B.D.,andE.Broadhead.1974.ThediversityanddistributionofpsocidpopulationsonMangiferaindicaL.inJamaicaandtheirrelationshiptoaltitudeandmicro-epiphytediversity.JournalofAnimalEcology43:173 190.Whittaker,R.J.2010.Meta-analysisandmega-mistakes:callingtimeonmeta-analysisofthespeciesrichness productivityrelationship.Ecology91:2522 2533.Whittaker,R.J.,andE.Heegaard.2003.Whatistheobservedrelationshipbetweenspeciesrichnessandproductivity?Ecology84:3384 3390.Whittaker,R.J.,K.J.Willis,andR.Field.2001.Scaleandspeciesrichness:towardsageneral,hierarchicaltheoryofspeciesdiversity.JournalofBiogeography28:453 470.APPENDIXADetailsofthepapersusedasbasicdata(EcologicalArchivesE092-021-A1).APPENDIXBRelativefrequenciesdistributionsofSRArelationshipsobservedindifferenttaxaandindifferentclimaticandbiogeographicregions(EcologicalArchivesE092-021-A2). Ecology,Vol.92,No.1 ThestringentcriteriaofinclusionofSRAdatacame upwithasubsetof21datasetsthatshowedaconsistent orderintherelativeimportanceofthemostabundant SRApatternsthroughoutbothmethodsofanalysisand consensus(HS-H . DEC . L-PL;Fig.1d f).The percentagerepresentationofH-SHratherincreased,and L-PLdecreasedwiththevisualmethodandconsensus, comparedtothestatisticalmethod(Fig.1d f).The percentagerepresentationofNP,andmoreoverof CONT,waslowerthaninthewholedataset(compare Fig.1c,f). RelaxingtheselectionofSRAdata,cameupwithtwo datasubsetsof42(intermediatesubset)and46(lax subset)SRArelationships.Therelativefrequency distributionofdifferentSRApatternsinbothsubsets largelyfollowedtheobservedinthewholedatasetbyall methodsofanalysis(compareFig.1a candg l).The statisticalmethodshowedthe
8 highestpercentageofNP (Fig.1j,k).Thevisu.Thevisu")
highestpercentageofNP (Fig.1j,k).Thevisualmethodsomewhatdecreasedthe percentageofL-PLandNP,whichincreasedthe percentageofH-SHandofDEC(Fig.1h,k).The consensusconrmedthepredominanceofDEC,al- thoughtherewasahighpercentageofNPandCONT (Fig.1l).INCandU-SHpatternswererarethroughout (Fig.1j l). Aftercontrollingfordifferencesinsamplesize,we furtherconrmedthatrelaxingtheselectionofSRA dataincreaseduncertaintyintheestimationofthe magnitudeofSRArelationships(Fig.2). Therewasnoassociationofshapewithtaxonomyor climateafterourdatamanipulation(Table1,Appendix B:Figs.B2andB3),butasignicantbiogeographical relationshipwasevidentinthestringentsubset(Table 1),whichsuggestedthatH-SHpatternswererecorded onlyintheNearcticandPalearticregions,whereasDEC weremorefrequentintheNeotropics(AppendixB:Fig. B4). D ISCUSSION OurmanipulationofSRArelationshipsintodifferent subsetsofdatashowedthatthequalityofbasicdata selectedformeta-analysisiscrucialtoreliableidentify shape(seeWhittaker2010fordiscussion).Weconrmed thetwopredictionsproposedattheoutsetofthepresent study.Ingeneral,uncertaintyoveridenticationof shapeincreasedasthecriteriaofinclusionofstudiesinto theanalysisbecamemorelax;studiesthatconformedto stringentselectioncriteriashowedrobustnessinthe SRApatternstovariationinmethodusedtoidentify shape.Rahbek(2005)demonstratedthatdecisions concerningtheanalyticaldesignofindividualstudies cancompletelyturnaroundthestatisticaloutcome relatedtotheshapeoftheSRApattern(butseeRowe andLidgard2009).Ourstudyshowedhowtheseeffects couldalsointeractwithtwomethods(statisticaland visual)usedtoidentifyshapetoaffecttheoverall relativefrequencydistributionsofSRApatterns. ThetotalSRArelationshipstakentogethersuggested thepredominanceofmonotonicdecreasingpatterns afterconsensus.However,theapplicationofstringent selectioncriteriaconrmedthepredominanceofhump- shapedpatternsovermonotonicdecreasingones.In general,therelativefrequencyofpatternsinthewhole datasetparalleledthosefoundintheintermediateand laxsubsets,whichtakentogetherrepresented . 80 % of theSRArelationshipsinourstudy.Changesinthe proportionalrepresentationofshapesafterdatamanip- ulationwerenotassociatedwithclimateandtaxonomy, althoughwefoundanassociationwithbiogeographyin thestringentsubset.Thisassociationsuggesteda F IG .2.Effectofrelaxingtheselectioncriteriaofstudies, fromstringent(triangles),tointermediate(circles),andlax (squares),overuncertainty(shownas95 % condenceintervals) intheestimationofacommoneffectsize( z r ,Fishers z - transformation)forH-SH(hump-shaped),DEC(monotonic decreasing),andL-PL(low-plateau)patterns. T ABLE 1.Testsofassociationbetweentherelativedistributionoffrequenciesofthethreemostabundantpatterns(hump-shaped, monotonicdecreasing,andlow-plateau)ofarthropoddistributionafterconsensusandtaxonomy,climate,andbiogeography. Testofassociation StringentIntermediateLax FIdf P FIdf P FIdf P Taxa 3 SRApattern13.648100.11711.086120.82614.080140.706 Climaticregion 3 SRApattern15.425120.17915.534140.15714.333160.987 Biogeographicregion 3 SRApattern13.81060.0039.35680.27111.346120.818 Notes: Abbreviationsare:FI,permutation-basedFisher-Freeman-Haltonstatistic;df,degreesoffreedom; P ,probabilitylevel; SRA,speciesrichness altituderelationship.See Methods fordescriptionsofthestringent,intermediate,andlaxselectioncriteria. NOTES 258 Ecology,Vol.92,N