
Demonstration Testing to Optimize Treatment Plant Performance John Civardi PE Hatch Mott MacDonald September 19 2013 Outline Background of Aqua Shenango Water Treatment Plant Operational Issues and Treatability Study ID: 677052
Download Presentation The PPT/PDF document "Effective Use of Filter Pilot Testing an..." is the property of its rightful owner. Permission is granted to download and print the materials on this web site for personal, non-commercial use only, and to display it on your personal computer provided you do not modify the materials and that you retain all copyright notices contained in the materials. By downloading content from our website, you accept the terms of this agreement.


Slide1
Effective Use of Filter Pilot Testing and Chlorine Dioxide Demonstration Testing to Optimize Treatment Plant PerformanceJohn Civardi, PE – Hatch Mott MacDonaldSeptember 19, 2013Slide2
OutlineBackground of Aqua Shenango Water Treatment PlantOperational Issues and Treatability Study
UV Peroxide at ShenangoDAF Pilot Testing
Filter Testing Phases 1, 2, and 3Chlorine Dioxide Testing, bench and demonstrationWhere We Are NowSlide3
Plant Background
Capacity 16 MGD
Raw water from the Shenango River in Sharon, PA.
Treatment: ballasted flocculation and dual media filtration, chlorine for primary disinfection and chloramines for secondary disinfectionPlant commissioned in early 2000.
Slide4
Plant Schematic
Pilot Area
Shenango
River
Raw Water Pump
Filters
KMnO4
Clearwell
ACTIFLO
Chlorine
Alum
Lime
Soda Ash
PAC
Chlorine
Caustic Soda
Filter Aid Polymer
Chlorine
Corrosion Inhibitor
PAC
Ammonia
To Distribution
Caustic Soda
Soda Ash
FluorideSlide5
Plant Operational IssuesDisinfection By-ProductsRange HAAs (53.7-97.7 ppb)
Range TTHMs (39.0-85.1 ppb)UFRVs< 10,000 gal/
sf, Short Filter RunsAlgaeT&O Geosmin
and MIB at 160 ng/LManganeseSlide6
Water Quality Raw & Treated (Average Conditions)
Turbidity (NTU)
TOC (mg/l)
Algae (Counts/ml)
Manganese (ppm)
Raw9.6
5.6716535
0.11Filter Influent
0.853.46
8800.03
Treated0.08
3.1211
ND
Shown Data collected from Pilot Study from 9/15/11 to 1/23/2012
Water Quality/Performance Issues (Maximum
Conditions)
Turbidity (NTU)
TOC (mg/l)
Algae (Counts/ml)
Manganese (
ppm
)
Raw
102.1
7.1
37440
0.33
Filter Influent
3.39
6.4
2480
0.08
Treated
0.16
4.1
36
0.08Slide7
Treatability StudyOptions Matrix
River
4 MG Pre
Sed
Basin
Replace Filter Media
Option 1:
PAC KMnO4
UV-H
2
O
2
Clearwell
Several variations were also considered
Option 2:
River
ACTIFLO
Ozone
Replace Filter Media
CLO
2
UV-H
2
O
2
Clearwell
Option 3:
River
ACTIFLO
DAF
Replace Filter Media
CLO
2
UV-H
2
O
2
Clearwell
ACTIFLOSlide8
Historical T&O Treatment and ProblemsPowdered Activated Carbon
Residuals Generation
PAC provided limited removal especially with Actiflo
Competitive effects of alumCould PAC be optimized and is AOP a suitable option?Slide9
Bench Testing at Aqua’s Neshaminy
WTP
Removal of up to 90%
Geosmin & MIB is desired at maximum plant capacity
Aqua and Carbon Supplier performed jar tests with Geosmin to assess :
Potential competitive effects of alum on carbon usage – literature contained limited dataOptimum type of PAC
Optimum dose and detention timeSlide10
PAC Testing ResultsDosing PAC together with alum results in significantly lower MIB removal (28% removal Alum/PAC
vs
55% PAC then alum)Testing found that PAC should be added prior to alumMinimum PAC detention time is 45 minutes
Min./Max. PAC dosage is 30 mg/L - 60 mg/LSlide11
Plant Impacts of Testing45 Minutes of Detention Time at 15 MGD requires at 500,000 gallon pre-carbon contact tank with mixers
30 mg/L dosage results in an additional 3,800
ppd of Dry Solids
This would double the plant solids production and require additional residuals treatment equipmentSlide12
Cost Comparison AOP vs PAC
UV – H2O2
PACCapital
$2.5 Million$2.2 Million
O&M$200,000
$310,000Equivalent Uniform Annual Cost
$384,000
$475,000Slide13
A Bit About Carbon FootprintSlide14
Comparison with PACNo additional sludge handling is needed whereas the PAC process will generate approx 1.5 tons per day of dry solids (
100% increase in solids production
)Ability to provide 1 log and higher removal of MIB and Geosmin
Ability to achieve additional microbial disinfection
Smaller footprint than the PAC optionProduces less than 25% CO2 compared to UV/Peroxide
Aqua Selected UV-PeroxideSlide15Slide16
UV Process Layout
Shenango
WTPSlide17
UV Process Layout
Shenango
WTP
Hydrogen Peroxide
UV Reactor
Flow Meter
Chlorine
Cooling Water Return
Cooling Water Supply
NCSlide18Slide19Slide20Slide21
Treatability Study to Optimize Filtration
Technical Experts
Workshops
Selected DAF, Filters, and Chlorine Dioxide
DAF minimizes residuals, low polymer use, algae performance
ACTIFLOSlide22
Recommended Option SchematicShenango River
Raw Water Pump
Filters
KMnO4
Clearwell
ACTIFLO
Chlorine
Alum
Lime
Soda Ash
PAC
Chlorine
Caustic Soda
Filter Aid Polymer
Chlorine
Corrosion Inhibitor
PAC
Ammonia
To Distribution
Caustic Soda
Soda Ash
Fluoride
Pilot: Dissolved Air Flotation
Pilot: Filter Optimization
To Waste
Integration of DAF into the PlantSlide23
Pilot TestingControl/BaselineComponentsCoordination with RegulatorsVendors
Why Pilot Test?Proof of Design ConceptSlide24
Pilot Testing ContinuedThe TeamOwner: Aqua, PA Plant Staff and Main Office Water Quality, Engineering, and Laboratory in Bryn
Mawr, PAEngineer: HMM Pilot Engineer (Pittsburgh, PA), Data Review & Coordination (Millburn, NJ)
Vendors: DAF Supplier (IDI), Filter ConstructorPADEP – Protocol ApprovalCost – New Filter Columns, DAF Rental, Power, ChemicalsData Management
Communication: Weekly Conference CallsSlide25
Pilot TestingContinued
Backwash Controls
Filter Columns
Online AnalyzersSlide26
ProtocolThree seasons: (1) High Algae (2) Cold Water (3) High TurbidityPhase 1: Filter Optimization (9/27/11 - 10/13/11)
Phase 2: DAF and Filters at Control Steady State (10/20/11 - 11/23/11)Phase 3: Filter Optimization for Ballast Flocculation (12/6/11 – 1/24/2012)
Phase 4: Chlorine Dioxide AdditionControl Column with Same Media as Existing Plant Filters High Turbidity Modifications with Pre-Sedimentation TankIntegrated Chlorine Dioxide & Sulfuric AcidSlide27
Pilot Testing Schematic
pH Adjustment
Raw Water
Coagulant
Flocculation Chambers
Sample Point
Polymer (if needed)
Air Compressor & Saturator
DAF Tank
Clarified Water
Sludge Scraper
Recycle Pump
To Filters
To Waste
Filter Column 60
Filter Column GAC
Filter Column 47
Filter Column 72
To Waste
From ACTIFLO
Same Configuration as PlantSlide28
Testing Matrix & Lab Coordination
Regular
Analytical Schedule
Measurement
Sample Point
Frequency
Field or Lab
1
1
2
3
4
Raw Water
Pilot Filter Column Effluent
Plant Clarified Water
Plant Combined Filter Effluent
Turbidity
X
X
X
X
Online and manually once per day
Field
Particle Counts
X
X
X
X
Online
Water Temperature
X
Once per day
Field
pH
X
X
X
X
1,2 Online and all manually once per day
Field
True Color
X
X
X
X
Once per day
Field
UV
254
X
X
X
X
Once per day
Field
TOC/DOC
X
X
X
X
Twice per week
Lab
Alkalinity
X
X
Once per day
Field
Filterability
X
Once
per day
Field
Aluminum (total and dissolved)
X
X
X
X
Once per day
Lab
Iron
X
X
X
X
Once per day
Lab
Manganese
X
X
X
X
Once per day
LabSlide29
Testing Schedule
Optimizing: pH, Acid & CLO
2
Dosage, Flow Rates.
Filter
Optimization with
Chlorinated ACTIFLO Water
Chlorine Dioxide
Optimize Filter
DAF Running at Steady StateSlide30
Phase 1: Optimize Filter using Treated ACTIFLO Water
Filter Media Configuration
Pilot
Filter
Column
Sand
Media
Depth (in)
Effective Size (mm)
Uniformity CoefficientType
Depth (in)Effective Size (mm)
Uniformity CoefficientTotal Media Depth (in)
47
12
0.45-0.55
1.4
Anthracite
35
0.85-0.95
1.4
47
60
12
0.45-0.55
1.4
Anthracite
48
1.15-1.25
1.4
60
72
120.65-0.75
1.5Anthracite60
1.45-1.551.4
72GAC12
0.45-0.551.4GAC60
1.0-1.21.572
Column 47 Represents the Configuration of the Plant’s Filter
Initial Filter Testing ResultsSlide31
Phase 1 Conclusion: Filter GAC had Lower Run Times than Existing Plant Filter Configuration. Filter 72 had the Longest Run Times Compared to All Columns
Replace Filter GAC with Filter 72 Configuration Under ACTIFLO Treated Water for Benchmark Comparison to DAF
Continue to Phase 2
2013 NYC Watershed/
Tifft
Science and Technical Symposium
Initial Filter Testing ResultsSlide32
DAF & Filter Testing
Filter Media Configuration
Pilot
Filter
ColumnSand
Anthracite
Depth (in)
Effective Size (mm)
Uniformity CoefficientDepth (in)
Effective Size (mm)Total Media Depth (in)
4712
0.45-0.551.4
350.85-0.95
47
60
12
0.45-0.55
1.4
48
1.15-1.25
60
72
12
0.65-0.75
1.5
60
1.45-1.55
72
72
12
0.65-0.75
1.5
60
1.45-1.55
72
Phase 2: Dissolved Air Flotation Under Steady State ConditionsColumn 72 is the Optimal Configuration from Phase 1 using ACTIFLO Treated WaterColumn 47 is the Existing Plant Configuration using DAF Treated Water
Column 47 Represents the Configuration of the Plant’s FilterSlide33
DAF TestingSlide34
DAF & Filters During High Turbidity Events
PA
Raw
Water (Primary Axis) & Filter Influent (Secondary Axis)
Turbidity SpikeSlide35
DAF & Filters During High Turbidity Events
PA
Phase 2: Effluent Turbidity with DAF Treated Water
Turbidity Spike
Filter 1: 35” Anthracite
Filter 2: 48” Anthracite
Filter 3: 60” Anthracite
Filter 4: 60” Anthracite (ACTIFLO)
ACTIFLOSlide36
DAF & Filters During High Turbidity Events
Phase 2: Effluent Turbidity with DAF Treated Water
Turbidity Spike
ACTIFLO
Date
47
60
72
72Slide37
Initial Conclusions
Filter
ACTIFLO
Treated Water
DAF Treated Water
Comparison DAF/ACTIFLO
Phase (No.)
Average UFRV (gals/sf)
Phase (No.)
Average UFRV (gals/sf)
UFRV (Ratio)
47
1
4,542
2
11,512
2.53
60
1
7,211
2
15,516
2.15
72
1
8,670
2
15,507
1.79
DAF Improved Filter Runs (UFRV)
DAF Could Not Handle High Turbidity Events and the Addition of Pre-sedimentation was not Cost Effective
Next Step – Optimize Filters for ACTIFLOSlide38
Additional Filter TestingPhase 3: Filter Optimization with Chlorinated ACTIFLO Treated Water Under Cold Temperature Conditions Column 47: Existing Plant’s Configuration
Column 60 & 72: Optimal Configurations from Phases 1 & 2
Filter Media Configuration
Pilot
Filter
Column No.
Sand
Anthracite
Depth (in)
Effective Size (mm)
Uniformity Coefficient
Depth (in)Effective Size (mm)
Uniformity CoefficientTotal Media Depth (in)
47
12
0.45-0.55
1.4
35
0.85-0.95
1.4
47
60
12
0.45-0.55
1.4
48
1.15-1.25
1.4
60
72
12
0.65-0.75
1.5601.45-1.55
1.472
Column 47 Represents the Configuration of the Plant’s FilterSlide39
Filter Data #1
Phase 3:
Turbidity Under Protocol Threshold
Date
47
60
72Slide40
Phase 3: Head-Loss with ACTIFLO Treated WaterBackwash Occurs when Head-Loss Reaches 120 Inches
Filter Data #2
Filter’s 60 & 72 Have Longer Run Times Compared to Filter 47 (Existing Plant)
Date
47
60
72Slide41
Evaluation of Filter Data & Selection of Media
Table 3.1: Filter Performance Evaluation Criteria Summary*
Pilot
Filter
Media Configuration
Filtered Water Turbidity
Filter Run Volume
Filtered Water Color (true)
Filtered Water Manganese:
< 0.1 NTU
> 7,500 gal. at < 10 ft headloss
< 5 Pt-Co color units
< 0.01 mg/L
47
35” Anth./12” Sand (control)
60
48” Anth./12” Sand
+
72
60” Anth./12” Sand
GAC
60” GAC/12” Sand
* A “
” indicates that the evaluation criteria goal was achieved. A “
+
” indicates that the filter media performed better than the existing plant’s filter media. Slide42
Evaluation of Filter Data & Selection of MediaSummary of PADEP Requirements: Effective Size, Length/Depth RatiosMin. 12 in of Media in Effective Size Range No Greater than 0.45 to 0.55 mm
Ratio Depth (in) to Media Effective Size (mm) Greater than 40Anthracite Effective Size 0.8 mm to 1.2 mm, Uniformity Coefficient No Greater than 1.7
Sand at Least 85% Siliceous Material with an Effective Size of 0.45 to 0.55 mm and a Uniformity Coefficient No Greater than 1.65CostAvailability of MediaSlide43
Evaluation of Filter Data & Selection of MediaSelection of Filter Media: Column 60Improved UFRV by 40%, Meaning Longer Filter Runs
Complies with PADEP StandardsDeeper Anthracite Layer with Larger Effective Size
Additional 2 Inches of Sand for Pathogen BarrierAchieves Water Quality Similar to Existing Filters
Optimal Filter Media Configuration Selected
Pilot
Filter
Column No.
Sand
Media
Depth (in)
Effective Size (mm)
Uniformity Coefficient
Type
Depth (in)
Effective Size (mm)
Uniformity Coefficient
Total Media Depth (in)
60
12
0.45-0.55
1.4
Anthracite
48
1.15-1.25
1.4
60Slide44
Chlorine DioxideSlide45
Benefits of Chlorine Dioxide at the Shenango Plant
Oxidation of manganese before flocculation allows the manganese to be removed during the clarification process (ACTIFLO) and allows the chlorine dosage applied to the filter influent to be reduced or eliminated.
Reduction of the chlorine dosage at the filter influent results in reductions in DBP formation in the
Shenango distribution system.
Chloramination can increase biofilm and cause nitrification in the distribution system. Chlorine dioxide normally breaks down to form chlorite ion. Studies have shown that the presence of chlorite ion in finished water results in better control of organisms in the distribution system, especially those which cause nitrificationSlide46
Approach at ShenangoBench TestingPilot Testing with DAFDemonstration TestingProcurementSlide47
Bench testing with ClO2Slide48
Bench Testing Chlorine DioxideSlide49
Bench Testing OzoneSlide50
How is CLO2 Delivered?ClO2 is best supplied via On-Site Generation SystemsClO2 gas is too energetic to package and ship - heat, light, pressure, shock sensitiveRoad transport of ClO2 gas or solutions is not allowed
Bulk Shipment of CDG 3000 (0.3%) contains 6
lbs chlorine dioxideWhich are then either oxidized or reduced to obtain chlorine dioxide:ClO3- chlorate ion
ClO2 chlorine dioxide ClO2- chlorite ionSlide51
Demonstration TestingThe purpose of this full scale test was to evaluate the effectiveness of chlorine dioxide as a pre-oxidant to improve the following:
Manganese removal in the ballasted flocculation system.
Reduction in filter top chlorine dose while still achieving similar pathogen inactivation. Pre-oxidation with chlorine dioxide was expected to reduce the chlorine demand and allow a reduction in the applied disinfection chlorine dose while still maintaining the same effluent chlorine residual.
Reduction in formation of DBPs in the combined filter effluent.Slide52
Demonstration TestThe CLO2 system delivered 15 to
150 pounds per day (ppd
) of chlorine dioxide. At an average plant flowrate of 9.5 MGD and a dose of 1.0 mg/L, approximately 80
ppd of chlorine dioxide was used. At a maximum plant flowrate
of 16.0 MGD and a dose of 1.0 mg/L, approximately 135 ppd of chlorine dioxide was used.
The chlorine dioxide system was furnished by Siemens and was a Millennium III™ C-150 Auto two chemical flow-pacing chlorine gas/sodium chlorite chlorine dioxide generator capable of producing up to a maximum of 150 lbs
/ day of chlorine dioxide with a 10:1 turn-down and automatic flow-pacing capability. Chlorine gas was supplied using the plant’s existing pre-chlorinator. Sodium chlorite at a strength of 25% was used and was delivered in 250 gallon totes. At the maximum chlorine dioxide usage of 150 ppd
, 84 gallons of sodium chlorite was used and 79 pounds of chlorine was used. As this was a demonstration test treating the entire plant flow, design standards from the Pennsylvania Department of Environmental Protection’s Public Water Supply Manual 383-2125-108 Section IV.B.2 were followed. Slide53
FindingsSlide54
Chlorite LevelsSlide55
SummaryUV-Hydrogen Peroxide is feasible and cost effective for Geosmin and MIB reductionDAF provided significant improvement to UFRV but raw water turbidities above 20 NTU were problematic
Chlorine Dioxide can be purchased and used for 100 gpm
pilot studies for feasibility studiesChlorine Dioxide can be cost effectively tested at plant flowrates on the order of 20 MGD Slide56
AcknowledgementsAqua, PA American WaterPete Kusky, Plant SupervisorBill Young, Plant Chemist
Larry Wehr, Process ControlsMarc Lucca, VP of Production
Craig Lutz, Water Quality SpecialistDoug Crawshaw, Production EngineerBill McGinty, Manager of Treatment/QC
Jack Walter, Division ManagerInfilco (IDI), SiemensHatch Mott MacDonald (HMM)Josef Argenio, EIT
Mark Tompeck, PE
Thank YouSlide57
Phase 1: Head-Loss with ACTIFLO Treated Water
Backwash Occurs when Head-Loss Reaches 120 Inches
Filter’s 60 & 72 Have the Longest Run Times
Existing Plant
Filter
Date
47
60
72
GAC
Initial Filter Testing ResultsSlide58
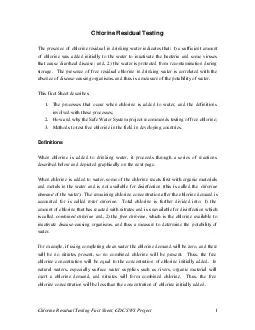
At room temperature, chlorine dioxide (ClO2) is a light sensitive gas denser than air, yellow/greenish in color, highly soluble in water, with a chlorine like odor.
Cl
O
O
ClO
2
Molecular Structure
Technical OverviewSlide59
Technical OverviewChlorine Dioxide belongs to the family of chemicals known as Oxidizers. CLO2 is also a powerful disinfectant. Ozone
Hydrogen Peroxide
ChlorineChlorine DioxideMeasured by ORP potentialSlide60
Why Chlorine Dioxide?Cost effective disinfectant for regulatory compliancedeclining surface water quality favors CLO2effective @ pH 2-10
enhanced CxT’s for crypto and giardia
reduces THM’s, THAA’s and AOXEPA approved for primary and residual disinfectionSelective oxidant reduces
Mn / Fe, assists on particle count reduction and enhances filter runsImproves taste and odor, oxidizes / destroys sulfides, certain humics
/ fluvics / phenolsSuperior DBP control:residuals measurable, well studied
does not oxidize bromide to bromate; no reaction with ammoniadoes not chlorinate organicsSlide61
Disinfection with ClO2Broad spectrum biocide bacteria, viruses, fungi, algae, mollusks and biofilm
Provides CxT credits effective for Giardia and Cryptosporidium in multiple barrier approach
lower “CxT” values versus Cl2 and chloraminesSynergy with UV (pre or post UV for wastewater and reclaim water)
Effective pH 2 to 10does not oxidize bromide to bromate
does not react with ammonia is often more effective and less costly than permanganate in reducing manganese and iron concentrationsPoints of Application
ahead of chlorination or chloramination to reduce THM’sfollowing UV for residual and enhanced disinfection
ahead of ozone to reduce ozone demand and minimize bromatecompatible with chloramines - controls nitrificationSlide62
Auto Flow-Pacing “Chlorine Free” Chlorine Dioxide Generators (1 to 110 kg/hr)
12% Sodium Hypochlorite
15% Hydrochloric Acid 25% Sodium Chlorite
Chlorine in-situ on demandSlide63
Auto Batch Generator – 3 Chemical Slide64
THM Formation
Naock
&
Doerr
1978
“No THMs
with ClO
2
”Slide65
Biofilm ControlCLO2 penetrates and kills biofilmDoes not react with ammonia Retains disinfection capability with no need to overcome ammonia demand
Shown to reduce planktonic population by 98.72% and biofilm population by 99.88%Additional benefits due the chlorite ion disinfection by-product:
retards nitrification issues extends life of chloramines
Walker, J.T. and M. Morales. 1997. Evaluation of Chlorine dioxide For The Control of Biofilms. Jour. Water. Sci. Tech.. 35:11 (319-323)
McGuire, M.J., N. I Lieu and M. S.
Pearthree
. 1999. Using chlorite ion to control nitrification. Jour. AWWA. 91:10 (52-61)
Gates, D. 1998. Chlorine Dioxide Handbook, Water Disinfection Series.
Denver,CO: AWWA. Pp. 63 - 64.Slide66
Point of AdditionTo eliminate prechlorination (thereby reducing DBP formation) Head of treatment train
Low demand waters Entry to treatment plant (in combination with coagulation)
High demand waters Intake (sufficient time to react)Turbid waters Will not remove TOC, but improves coagulation & particle counts
After sedimentation (reduced demand)Before ozonation to reduce demand on ozone and to help reduce bromate formation by ozone