
F M A Data Wrangling with pandas Cheat Sheet httppandaspydataorg Syntax Creating DataFrames Tidy Data A foundation for wrangling in pandas In a tidy data set F M A Each variable is saved in its own ID: 766471
Download Presentation The PPT/PDF document "F M A Data Wrangling" is the property of its rightful owner. Permission is granted to download and print the materials on this web site for personal, non-commercial use only, and to display it on your personal computer provided you do not modify the materials and that you retain all copyright notices contained in the materials. By downloading content from our website, you accept the terms of this agreement.


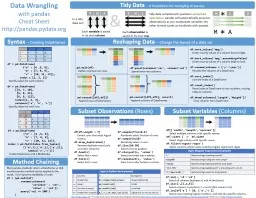
F MA Data Wranglingwith pandasCheat Sheethttp://pandas.pydata.org Syntax – Creating DataFrames Tidy Data – A foundation for wrangling in pandas In a tidy data set: FMA Each variable is saved in its own column & Each observation is saved in its own row Tidy data complements pandas’s vectorized operations. pandas will automatically preserve observations as you manipulate variables. No other format works as intuitively with pandas. Reshaping Data – Change the layout of a data set M A F * M A * pd.melt ( df ) Gather columns into rows. df.pivot (columns=' var ', values=' val ') Spread rows into columns. pd.concat ([df1,df2]) Append rows of DataFrames pd.concat ([df1,df2], axis=1) Append columns of DataFrames df.sort_values ('mpg') Order rows by values of a column (low to high). df.sort_values (' mpg',ascending =False)Order rows by values of a column (high to low).df.rename(columns = {'y':'year'})Rename the columns of a DataFramedf.sort_index()Sort the index of a DataFramedf.reset_index()Reset index of DataFrame to row numbers, moving index to columns.df.drop(columns=['Length','Height']) Drop columns from DataFrame Subset Observations (Rows) Subset Variables (Columns) abc147102581136912 df = pd.DataFrame( {"a" : [4 ,5, 6], "b" : [7, 8, 9], "c" : [10, 11, 12]}, index = [1, 2, 3]) Specify values for each column.df = pd.DataFrame( [[4, 7, 10], [5, 8, 11], [6, 9, 12]], index=[1, 2, 3], columns=['a', 'b', 'c']) Specify values for each row. abcnvd1471025811e26912 df = pd.DataFrame( {"a" : [4 ,5, 6], "b" : [7, 8, 9], "c" : [10, 11, 12]}, index = pd.MultiIndex.from_tuples( [('d',1),('d',2),('e',2)], names=['n','v'])) Create DataFrame with a MultiIndex Method Chaining Most pandas methods return a DataFrame so that another pandas method can be applied to the result. This improves readability of code.df = (pd.melt(df) .rename(columns={ 'variable' : 'var', 'value' : 'val'}) .query('val >= 200') ) df [ df.Length > 7]Extract rows that meet logical criteria.df.drop_duplicates()Remove duplicate rows (only considers columns).df.head(n)Select first n rows.df.tail(n)Select last n rows. Logic in Python (and pandas)<Less than!=Not equal to>Greater thandf.column.isin(values)Group membership==Equalspd.isnull(obj)Is NaN<=Less than or equalspd.notnull(obj)Is not NaN>=Greater than or equals&,|,~,^,df.any(),df.all()Logical and, or, not, xor, any, all http://pandas.pydata.org/ This cheat sheet inspired by Rstudio Data Wrangling Cheatsheet (https://www.rstudio.com/wp-content/uploads/2015/02/data-wrangling-cheatsheet.pdf) Written by Irv Lustig, Princeton Consultants df [[' width','length','species ']] Select multiple columns with specific names.df['width'] or df.width Select single column with specific name.df.filter(regex='regex') Select columns whose name matches regular expression regex. df.loc[:,'x2':'x4'] Select all columns between x2 and x4 (inclusive).df.iloc[:,[1,2,5]] Select columns in positions 1, 2 and 5 (first column is 0).df.loc[df['a'] > 10, ['a','c']] Select rows meeting logical condition, and only the specific columns . regex (Regular Expressions) Examples'\.'Matches strings containing a period '.''Length$'Matches strings ending with word 'Length''^Sepal'Matches strings beginning with the word 'Sepal''^x[1-5]$'Matches strings beginning with 'x' and ending with 1,2,3,4,5'^(?!Species$).*'Matches strings except the string 'Species' df.sample ( frac =0.5) Randomly select fraction of rows. df.sample (n=10) Randomly select n rows. df.iloc [10:20] Select rows by position. df.nlargest (n, 'value') Select and order top n entries. df.nsmallest (n, 'value') Select and order bottom n entries.
Summarize Data Make New ColumnsCombine Data Setsdf['w'].value_counts() Count number of rows with each unique value of variablelen(df )# of rows in DataFrame.df['w'].nunique ()# of distinct values in a column.df.describe()Basic descriptive statistics for each column (or GroupBy) pandas provides a large set of summary functions that operate on different kinds of pandas objects ( DataFrame columns, Series, GroupBy , Expanding and Rolling (see below)) and produce single values for each of the groups. When applied to a DataFrame , the result is returned as a pandas Series for each column. Examples: sum() Sum values of each object. count() Count non-NA/null values of each object. median()Median value of each object.quantile([0.25,0.75])Quantiles of each object.apply( function)Apply function to each object.min() Minimum value in each object.max()Maximum value in each object.mean()Mean value of each object.var()Variance of each object.std()Standard deviation of each object. df.assign (Area=lambda df : df.Length * df.Height ) Compute and append one or more new columns. df ['Volume'] = df.Length*df.Height*df.Depth Add single column.pd.qcut(df.col, n, labels=False)Bin column into n buckets. Vector function Vector function pandas provides a large set of vector functions that operate on all columns of a DataFrame or a single selected column (a pandas Series). These functions produce vectors of values for each of the columns, or a single Series for the individual Series. Examples: shift(1)Copy with values shifted by 1.rank(method='dense')Ranks with no gaps.rank(method='min')Ranks. Ties get min rank.rank(pct=True)Ranks rescaled to interval [0, 1].rank(method='first')Ranks. Ties go to first value.shift(-1)Copy with values lagged by 1.cumsum()Cumulative sum.cummax()Cumulative max.cummin()Cumulative min.cumprod()Cumulative product. x1 x2A 1B2C3x1x3ATBFDT adfbdfStandard Joins x1 x2x3A1TB2FC 3NaNx1x2x3A1.0TB2.0 FD NaNT x1 x2 x3A1 TB2Fx1x2x3A1TB 2F C3NaN DNaNTpd.merge(adf, bdf, how='left', on='x1')Join matching rows from bdf to adf.pd.merge(adf, bdf, how='right', on='x1')Join matching rows from adf to bdf.pd.merge(adf, bdf, how='inner', on='x1')Join data. Retain only rows in both sets.pd.merge(adf, bdf, how='outer', on='x1')Join data. Retain all values, all rows.Filtering Joinsx1x2A1B2x1x2C3adf[adf.x1.isin(bdf.x1)]All rows in adf that have a match in bdf.adf[~adf.x1.isin(bdf.x1)]All rows in adf that do not have a match in bdf.x1x2A1B2C 3x1x2B2C3 D4ydfzdfSet-like Operationsx1x2B2C3x1x2A1B2C3D4x1x2A1pd.merge(ydf, zdf)Rows that appear in both ydf and zdf(Intersection).pd.merge(ydf, zdf, how='outer')Rows that appear in either or both ydf and zdf(Union).pd.merge(ydf, zdf, how='outer', indicator=True).query('_merge == "left_only"').drop(columns=['_merge'])Rows that appear in ydf but not zdf (Setdiff).Group Data df.groupby (by="col") Return a GroupBy object, grouped by values in column named "col".df.groupby(level="ind")Return a GroupBy object, grouped by values in index level named "ind".All of the summary functions listed above can be applied to a group. Additional GroupBy functions:max(axis=1)Element-wise max.clip(lower=-10,upper=10) Trim values at input thresholdsmin(axis=1)Element-wise min.abs()Absolute value.The examples below can also be applied to groups. In this case, the function is applied on a per-group basis, and the returned vectors are of the length of the original DataFrame.Windowsdf.expanding()Return an Expanding object allowing summary functions to be applied cumulatively.df.rolling(n)Return a Rolling object allowing summary functions to be applied to windows of length n.size()Size of each group.agg(function)Aggregate group using function.Handling Missing Datadf.dropna() Drop rows with any column having NA/null data.df.fillna(value)Replace all NA/null data with value.Plotting df.plot.hist() Histogram for each columndf.plot.scatter(x='w',y='h')Scatter chart using pairs of pointshttp://pandas.pydata.org/ This cheat sheet inspired by Rstudio Data Wrangling Cheatsheet (https://www.rstudio.com/wp-content/uploads/2015/02/data-wrangling-cheatsheet.pdf) Written by Irv Lustig, Princeton Consultants