
Katherine Sun Clean up Clean up Everybody do Your Share 1 Get dataset from World Bank All Countries 1970s on No regions 2 Clean up and trim Country Code only Code has difficulties with spaces ID: 465817
Download Presentation The PPT/PDF document "GDP/Capita Improvement vs. Factors" is the property of its rightful owner. Permission is granted to download and print the materials on this web site for personal, non-commercial use only, and to display it on your personal computer provided you do not modify the materials and that you retain all copyright notices contained in the materials. By downloading content from our website, you accept the terms of this agreement.


Slide1
GDP/Capita Improvement vs. Factors
Katherine SunSlide2
Clean up, Clean up, Everybody do Your Share…Slide3
1. Get dataset from World Bank
All Countries
1970’s on
No regionsSlide4
2. Clean up and trim
Country Code only
Code has difficulties with spaces
Remove regions
Replace .. With “”
Convert to
csvSlide5
3
. CODE
Modification of movie code, but much more robust and in-depth
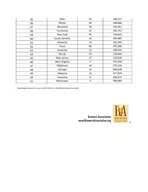
Natural map ranking
Reverse order, because lazy programming
Take in data, replace blanks with ‘0’
Mean
Sum all existing for a country
Divide by
num
of existing entries
Ignore 0’s
Rate (This one used like a billion revisions)
Search for first filled index
Compare difference for each filled index / number of blanks in between (for
avg
rate)
Ignore 0’sSlide6
Mean vs. Rate
Though I wanted to compare as change over time, total mean is interesting and possibly indicative too.Slide7
4
. Running the data through!
At least this only required changing a line of code each time…
Then saving the result in a text file.Slide8
4
. More Code!
Now I need to take the GDP data and match it to my other datasets to find a correlation.
I decided to use a scatterplot and find the R-values for the resulting plots.
New code for more data-pipelining!
Parse the
gdp
and data datasets I made
If a country is on both lists, add it to a map
X’s are
gdp
, y’s are data
Print and saveSlide9
4
. Even More Code!
Because online
graphers
/calculators are finicky and want the x’s and y’s
seperatelySlide10
4
. ???
5. ProfitSlide11
Results!!!
What we’ve all been waiting for… DrumrollSlide12
R = -0.1786
Huh.
Actually, countries with the lower GDP/capita have the most room to improve on literacy rate.
So the graph would support that, as high literacy increases are associated with lower GDP/capita rate.Slide13
R = -0.182
Maybe that’s the same for contraceptives?
Though there is more variance in the data still.
It also seems contraceptives overall are pretty popular, but have rates less correlated with GDP/capita.Slide14
R = 0.2306
Worldwide the rural population is decreasing.
Only a few are actually increasing.
Of them… what is happening to you Liechtenstein?
Maybe the rural population is increasing because greater wealth means more summer homes?Slide15
R = 0.0158
I thought this would be a good indicator for a government that invests in its populace, and would hopefully indicate that government intervention can be beneficial.
While most dots are clustered around the middle, there seems to be a suggestion that decreasing rates of government spending are correlated with higher GDP.
But the r value indicates a positive correlation?
Weird.Slide16
R= 0.2096
I had hoped increased gender equality would correlate with increasing rates of GDP/capita.
A positive
r-value
does support that!
Yay.Slide17
Oops I did it again…
FallaciesSlide18
North Korea == Most Literate Country
If the data isn’t true…Slide19
Correlation? Causation? Cause or Effect?
I can’t be sure if what I found is a cause of GDP/Capita change, or effect thereof.
The data… means?Slide20
Incomplete Data
Some data started from 1980, or even 1990 with female labor force participation
Where did you come from?
Where did you go?
Cotton Eye JoeSlide21
Inconclusive Data
Houston… We’ve got no Variance.
Flatter than the Texas Plains