
Thermochemistry Ms DiOrio Rm 109 Contents Heat Heat and Temperature Law of Conservation of Energy Work and Internal Energy EndothermicExothermic Reactions and Potential Energy Diagrams Calorimetry Heat Capacity and Specific Heat ID: 783195
Download The PPT/PDF document "Unit 5: Thermodynamics &" is the property of its rightful owner. Permission is granted to download and print the materials on this web site for personal, non-commercial use only, and to display it on your personal computer provided you do not modify the materials and that you retain all copyright notices contained in the materials. By downloading content from our website, you accept the terms of this agreement.


Slide1
Unit 5:Thermodynamics &Thermochemistry
Ms. DiOrio
Rm 109
Slide2Contents
Heat
Heat and Temperature
Law of Conservation of Energy, Work, and Internal Energy
Endothermic/Exothermic Reactions and Potential Energy DiagramsCalorimetry, Heat Capacity, and Specific HeatBond EnergiesHeat of Reaction and Standard Enthalpy of FormationHess’s Law
Thermodynamics
Laws of Thermodynamics
Spontaneous Processes and Entropy
Entropy and Enthalpy
Free Energy
Nonspontaneous Processes
Kinetic vs. Thermodynamic Control
Slide3Heat and Temperature
Slide4Recall the Kinetic Molecular Theory
All of the molecules in a sample are in motion.
Temperature is a measure of the average kinetic energy of atoms and molecules.
Temperature is a property
The Kelvin temperature of a sample of matter is proportional to the average kinetic energy.As temperature approaches 0 K, the average kinetic energy of a system approaches near zero.
Slide5The Maxwell-Boltzmann Distribution
At a specific temperature, we can plot the distribution of molecular velocities at any given time.
The peak of this curve is the most probable speed for a molecule at that temperature
Slide6The Maxwell-Boltzmann Distribution
Kinetic energies become greater (more disperse) as
temperature increases
Slide7Activation Energy
At a higher temperature, it is more probable to have a molecule that will meet the activation energy requirement for
a reaction to occur
Slide8HeatTwo systems with different temperatures that are in thermal contact will exchange energy
The quantity of thermal energy transferred from one system to another is called
heat
.
The process of kinetic energy transfer at the particular scale is referred to as heat transferThe spontaneous direction of the transfer is always from a hot to a cold body.
Slide9Heat Transfer On average, molecules in the warmer body have more kinetic energy than molecules in the cooler body (we saw this in the Maxwell Boltzmann distribution)
Collisions of molecules that are in thermal contact transfer energy
Scientists describe this process as:
“heat transfer”
“heat exchange”“transfer of energy as heat”
Slide10Heat Transfer Heating a system increases the energy of the system, and cooling a system decreases the energy.
Example:
A liter of water at 50
o
C has more energy than a liter of water at 25oC.
Slide11Thermal Equilibrium Eventually, thermal equilibrium is reached as the molecular collisions continue.
The average kinetic energy (and therefore the temperatures) of both substances is the same at thermal equilibrium.
Slide12A Note on HeatHeat is
NOT
a substance or a property.
It makes no sense that an object contains a certain amount of “heat”
“Heat exchange” or “transfer of energy as heat” refers to the process in which energy is transferred from a hot to a cold body in thermal contact
Slide13Law of conservation of energy, work, and internal energy
Slide14Energy Energy is defined as the capacity to do work or to produce heat.
Energy is neither created nor destroyed, but only transformed from one form to another
Energy is transferred between systems either through heat transfer or through one system doing work on the other system
Slide15Conservation of Energy When two systems are in contact with each other and are otherwise isolated, the energy that comes out of one system is equal to the energy that goes into the other system
The combined energy of the two systems remains fixed
Slide16First Law of Thermodynamics
Thermodynamic quantities are vectors, consisting of a number to indicate magnitude and a sign to indicate direction or flow.
The energy transferred from one system is equal in magnitude to energy transferred to the other system.
heat
work
Slide17Forms of Energy Transfer
Heat
Thermal energy transfer
Work
Work is defined by other scientific frameworks (Newtonian Mechanics or electromagnetism) as force acting over a distance For AP Chem, calculations are limited to those associated with changes in volume of a gas.
Slide18System vs. Surroundings
In order to describe energy changes, we must define the system and the surroundings.
The system is where the reaction occurs.
Everything else is the surroundings.
Surroundings
System
Slide19Signs of Heat and Work
Heat
+
Heat absorbed
(endothermic)
-
Heat released
(exothermic)
Work
+
Work done on the system
-
Work done by the system
Slide20Work by Changing Volume of a Gas
Pushing the piston down compresses the gas, doing work
on
the system
Work is positiveAn expanding gas does work by pushing up the pistonWork is negative
Slide21Energy Transfer
If a system transfers energy to another system, its energy must decrease. Likewise, if energy is transferred into a system, its energy must increase.
Chemical systems undergo three main processes that change their energy:
Heating/Cooling
Phase Transitions Chemical Reactions
Slide22Endo/Exothermic Reactions & Potential Energy Diagrams
Slide23Endo vs Exothermic Macroscopic observations of energy changes are made possible by measuring temperature changes
Net changes in energy for a chemical reaction can be endothermic or exothermic
Endothermic
Exothermic
Heat
required
released
Sign of ∆H
+
-
Slide24Graphical Representation: Endothermic
Slide25Graphical Representation: Exothermic
Slide26Enthalpy
The enthalpy change of reaction gives the amount of energy released (for negative values) or absorbed (for positive values) by a chemical reaction at constant pressure.
Internal energy
of the system
Pressure
Change in volume
Work
Slide27Enthalpy Change
At constant volume, the change in enthalpy (∆H) of the system is equal to the energy flow as heat.
Slide28Calorimetry, heat capacity, and specific heat
Slide29Phase Change Energy
Energy must be transferred to a system to cause a substance to melt (or boil).
The energy of the system therefore increases as the system undergoes a solid-to-liquid (or liquid-to-gas) phase transition. Likewise, a system releases energy when it freezes (or condenses).
The energy of the system decreases as the system undergoes a liquid-to-solid (or gas-to-liquid) phase transition.
The temperature of a pure substance remains constant during a phase change.
Slide30Phase Change Energy
Molar Heat of Vaporization:
the amount of energy needed to vaporize one mole of a pure substance
The energy released in condensation has an equal magnitude Molar Heat of Fusion: the amount of energy absorbed when one mole of a pure solid melts or changes from the solid to liquid state The energy released when the liquid solidifies has an equal magnitude
Slide31Phase Change Energy The heat of vaporization is always greater than the corresponding heat of fusion
It takes much more energy to break IMFS to become a gas than those to become liquid
Slide32Heat Capacity vs. Specific HeatThe transfer of a given amount of thermal energy will not produce the same temperature change in equal masses of matter with differing heat capacities.
Molar Heat Capacity:
the amount of energy needed to heat
1 mol of substance by 1∘C (units = J/oC mol) Specific Heat Capacity: the amount of energy needed to heat 1 g of substance by 1∘C (units = J/oC g)
Slide33Calorimetry
Calorimetry is an experimental technique that is used to determine the heat exchange/transferred into a chemical system.
Experimental Set-Up:
A chemical system is put in thermal contact with a heat bath.
The heat bath is a substance, such as water, heat capacity has been well established by previous experiments. A process is initiated in the chemical system, and the change in temperature of the heat bath is determined
Slide34Coffee Cup Calorimetry
Slide35Calorimetry Because the heat capacity of the heat bath is known, the observed change in temperature can be used to determine the amount of energy exchanged between the system and the heat bath.
The energy exchanged between the system and the heat bath is equal in magnitude to the change in energy of the system.
Slide36Calorimetry If the heat bath decreases in temperature, and therefore energy, the energy of the system increased by this amount.
Calorimetry may be used to determine heat capacities, enthalpies of vaporization, enthalpies of fusion, and enthalpies of reactions
Slide37Other Types of Calorimetry
In this course, we will only perform constant pressure calorimetry.
Bomb calorimetry is a different type of calorimetry that is performed under constant volume.
Slide38Bond Energies
Slide39Breaking vs. Making Bonds Breaking bonds requires energy (endothermic), and making bonds releases energy (exothermic)
Slide40Bond Energy Bond making and bond breaking are opposing processes that have the same magnitude of energy associated with them.
Convention is important!
Bond energy
is defined as the energy required to break a bond.
Slide41Heat of Reaction and Standard Enthalpy of Formation
Slide42Enthalpy vs. Internal Energy
For the purposes of thermodynamic analysis in AP Chemistry,
enthalpy
and
internal energy are not distinguished.
Slide43Energy Changes During Reactions
During a chemical reaction, bonds are broken and/or formed to change the potential energy of the
reaction system
The net energy change during a reaction is the sum of the energy required to break the bonds in the reactant molecules and the energy released in forming the bonds of the product molecules.
The net change is positive for endothermic and negative for exothermic
Slide44Bond Energies The average energy required to break all of the bonds in the reactant molecules can be estimated by adding up the average bond energies for all the bonds in the reactant molecules.
Likewise, the energy released in forming bonds is estimated for the product molecules.
If the energy required is greater than the energy release, then the reaction is endothermic and vice versa
Slide45Heat of Reaction (
)
For any given reaction, the enthalpy of the reaction can be calculated using:
Slide46Example
Calculate the heat of reaction for the following:
CH
4
(g) + 4Cl2(g) CCl4(g) + 4HCl(g)
Type of BondBond Energy (kJ/mol)
C-H
413
Cl-Cl
243
C-Cl
339
H-Cl
432
Slide47Standard Enthalpy of Formation (
)
The
Standard Enthalpy of Formation
is the change in enthalpy that accompanies the formation of one mole of a compound from its elements with all substances in their standard states.
The degree symbol on a thermodynamic function indicated that the process is carried out under standard conditions
Units: always given per mole of product with the product in the standard state (kJ/mol)
Slide48Conventions for Standard State Compounds
Gaseous substance is at a pressure of exactly 1 atm
Pure liquid or solid
In solution, concentration is exactly 1 M
Elements Form in which element exists at 1 atm and 25oC Could be solid, liquid, or gas depending on element
Slide49Finding
Over several years, scientists have run formation reactions over and over again to determine the
for specific compounds.
These values are now consolidated in reference tables for us to look up.
for an element in its standard state is zero!
Slide50Calculating
The enthalpy change for a given reaction can be calculated by subtracting the enthalpies of formation of the reactants from the enthalpies of formation of the products.
The magnitude of
H is directly proportional to the quantities of reactant and products in a reaction. If the coefficients in a balanced reaction are multiplied by an integer, the value of
H is multiplied by the same integer.
Slide51Example
Calculate
for the following:
2NO(g) + O
2(g) 2NO
2(g)
Compound
(kJ/mol)
NO(g)
90.25
O
2
(g)
0
NO
2
(g)
33.18
Compound
NO(g)
90.25
O
2
(g)
0
NO
2
(g)
33.18
Slide52Hess’s Law
Slide53Hess’s Law Going from a particular set of reactants to a particular set of products, the change in enthalpy is the same whether the reaction takes place in one step or a series of steps
Overall heat of reaction is the sum of enthalpy for each step
Slide54Hess’s Law
Slide55Rules with Hess’s Law If a reaction is reversed, the sign of
H is also reversed
The magnitude of
H is directly proportional to the quantities of reactant and products in a reaction. If the coefficients in a balanced reaction are multiplied by an integer, the value of H is multiplied by the same integer.
Slide56Hess’s Law Rules Practice
Original
Reaction
Original
Δ
HNew Reaction
New
Δ
H
-393.5 kJ
+1185 kJ
+91.8 kJ
-1299.5 kJ
Original
Reaction
Original
Δ
H
New
Reaction
New
Δ
H
-393.5 kJ
+1185 kJ
+91.8 kJ
-1299.5 kJ
+393.5 kJ
+2370 kJ
+45.9 kJ
+2599 kJ
Slide57Example
Given that:
C(s, graphite) + O
2
CO2 Ho = -393.5 kJ/molCO2 C(s, diamond) + O2 Ho
= +395.4 kJ/molCalculate the standard enthalpy of reaction for the following:C(s, graphite)
C(s, diamond)
C(s, graphite) + O
2
CO
2
H
o
= -393.5 kJ
CO
2
C(s, diamond) + O
2
H
o
= +395.4 kJ
+ ______________________________________________________
C(s, graphite)
C(s, diamond)
H
o
rxn
= +1.9 kJ
Slide58+ _____________________________________________
C(s) + O
2
(g)
CO2(g) Ho = -393.5 kJ/mol2S(s) + 2O2(g) 2SO2(g) Ho = 2(-296.8 kJ/mol) CS
2(l)
C(s) + 2S(s)
H
o
= -1(+87.9 kJ/mol)
Example
Given that:
C(s) + O
2
(g)
CO
2
(g)
H
o
= -393.5 kJ/mol
S(s) + O
2
(g)
SO
2
(g)
H
o
= -296.8 kJ/mol
C(s) + 2S(s)
CS
2
(l)
H
o
= +87.9 kJ/mol
Calculate the standard enthalpy of reaction for the following:
CS
2
(l) + 3O
2
(g)
CO
2
(g) + 2SO
2
(g)
CS
2
(l) + 3O
2
(g)
CO
2
(g) + 2SO
2
(g)
H
o
rxn
= -1075 kJ
Slide59Laws of Thermodynamics
Slide60What is thermodynamics?Thermodynamics is the study of energy and its interconversions.
There are three (really four) laws of thermodynamics.
Slide611st Law of Thermodynamics
Energy of the universe is constant.
The internal energy of a system is the sum of the kinetic and potential energies of all particles of a substance
The change in energy is the sum of work (w) and heat (q)
*Law
of Conservation of Energy
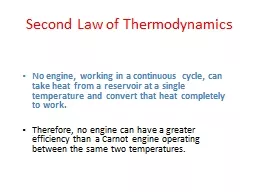
Slide622nd Law of Thermodynamics
Entropy of the universe is always increasing.
Entropy is a essentially measure of disorder
In any spontaneous process, there is always an increase in the entropy of the universe.
Slide633rd Law of Thermodynamics
The entropy of a perfect crystal at 0K is zero.
Entropy increases with temperature
There is also technically a
0th Law that came after the first three that states that if two systems are in thermal equilibrium with a third system, they are in thermal equilibrium with each other. The transitive property
Slide640th Law of Thermodynamics
Two systems in thermal contact will eventually reach thermal equilibrium.
Energy will be transferred as heat between systems until they reach the same temperature
Slide65The Laws of Thermodynamics
0
th
Law: This is the game.
1st Law: You can’t win. You can’t get more energy out of the system than you put in.2nd Law: You can’t break even. Any transfer of energy will result in some waste as entropy to the universe.3rd Law: You can’t get out of the game. You cannot achieve absolute zero.
Slide66Spontaneous processes and entropy
Slide67Entropy (S) Chemical or physical processes are driven by a decrease in enthalpy or an increase in entropy (or both)
Entropy
(S) is a measure of the dispersal of matter and energy (measure of molecular randomness or disorder)
It is a thermodynamic function that describes the number of arrangements (positions and/or energy levels) that are available to a system existing at a given state
Slide68Entropy Nature spontaneously proceeds toward the states that have the highest probabilities of existing (higher entropy)
Example:
There is only one way to perfectly stack a deck of cards but infinite ways to spread those cards across the universe.
Slide69Entropy In upper level chemistry, entropy can be understood in formal statistical terms; however, AP Chemistry focuses on describing entropy in qualitative terms
The emphasis of the AP curriculum is to be able to make predictions about the direction of ∆S
o
So is calculated relative to 0KSoreaction
=
n
p
S
o
products
-
n
r
S
o
reactants
Slide70Positional Entropy In a chemical reaction, the change in
positional entropy
is dominated by the relative numbers of gaseous reactants and products.
Each configuration that gives a particular arrangement is called a
microstate
Slide71Entropy in Phase ChangesEntropy increases when matter is dispersed.
During phase changes from solid
liquid gas, dispersal of matter occurs in the sense that individual particles become more free to move and generally occupy a larger volume
Due to positional probability
Slide72Entropy in Chemical Reactions Entropy can also increase in the context of individual particles in a chemical reaction
Entropy increases when the number of individual particles increases.
Entropy favors the side of the reaction with a larger number of species.
NaHCO
3 NaO + H2O + CO2
Slide73Entropy of Gases
For a gas, entropy increases when there is an increase in volume (at constant temperature)
More possible positions for gas to occupy
Recall the Maxwell Boltzmann distribution in which the kinetic energy of particles of a gas broadens as the temperature increases
This is an increase in the dispersal of energyAs temperature increases, the entropy increases
Slide74Entropy and Enthalpy
Slide75Entropy of the SurroundingsConsider an endothermic process (like vaporization), where ∆
S
sys
is increasing as energy flows from the surroundings into the system. Therefore ∆
Ssurr must be negative. Whether the process is spontaneous depends on temperature and the entropy changes in the surroundings, which are primarily determined by heat flow. The magnitude of ∆Ssurr depends on temperature.
Slide76∆Ssurr
The impact of the transfer of energy as heat to or from the surroundings will be greater at lower temperatures.
At constant pressure, heat flow is equal to ∆H
The negative accounts for the inverse relationship between endo/
exothermicity and entropySsurr
=
quantity of heat (J)/T (K)
S
surr
= -
H/T
Slide77Free Energy
Slide78Gibbs Free Energy (G)
Free energy
is a thermodynamic function that measures spontaneity including the dependence on temperature (derived from the 2
nd law)Units: J/mol A process (at constant T and P) is spontaneous in the direction in which the free energy decreases. (-∆G = spontaneous)G =
H - T
S
-
G =
S
surr
Slide79Sign of Go
Some
process involve
both
a decrease in the internal energy of the components (Ho < 0) and an increase in the entropy of those components (So > 0). These processes are necessarily “thermodynamically favored” since Go < 0.When
Go > 0, the process is not thermodynamically favorable. When
G
o
< 0, the process
is
thermodynamically favorable.
G =
H - T
S
Slide80Thermodynamic Favorability
Historically, the term “spontaneous” has been used to describe processes for which
G
o < 0.The phrase “thermodynamically favored” is used to avoid misunderstanding and confusion because of the common connotation for the term “spontaneous” meaning “immediately” or “without cause” Being thermodynamically favored does not mean that the reaction will proceed at a measurable rate.
Slide81Spontaneity from H and S
You can determine the spontaneity of a reaction from the signs of
H
and
S by finding the sign of G.G = H - T
S
Sign
H
Sign
S
Always Spontaneous
-
+
Never Spontaneous
+
-
Sometimes Spontaneous
-
-
+
+
Qualitative
Quantitative
Slide82When H and S have the same sign…
When
H
and
S have the same sign, we must calculate G to determine its sign. However, we are able to estimate the conditions G will be negative.G =
H - T
S
Temperature
Sign
H
Sign
S
Low
-
-
High
+
+
G is negative when
…
Slide83Equilibrium
A system is at equilibrium only when:
G =
0
Slide84Calculating Gibb’s Free Energy When a process is not drive by both entropy and enthalpy changes, then the Gibbs Free Energy change can be used to determine thermodynamic favorability
Standard free energy change
(∆G
o) is the change in free energy that will occur if the reactants in their standard states are converted to the products in their standard states.Go =
H
o
-
T
S
o
Slide85Standard Free Energy of Formation
The
standard free energy of formation
(
) is the change in free energy that accompanies the formation of 1 mole of a substance from its constituent elements with all reactants and products in their standard states
for an element in its standard states is zero.
We find
in reference tables
G
o
=
n
p
G
o
f
(products)
-
n
r
G
o
f
(reactants)
*We can also use Hess’s Law
Slide86∆G in Ideal Gases When dealing with ideal gases, pressure must be considered as it effects entropy
Entropy is highest at large volumes and low pressures
G =
Goreaction + RTln
(P)
Slide87Nonspontaneous processes
Slide88Nonspontaneous Reactions Not all reactions we want to occur are spontaneous
We can force reactions to occur by using external sources of energy to drive changes even if ∆G is positive
Electricity
Light
Coupling
Slide89Electricity Electricity may be used to cause a process to occur that is not thermodynamically favored.
Examples:
Charging
a battery
Electrolysis
Slide90Light Light may also be a source of energy for driving a process that in isolation is not thermodynamically favored.
Examples:
The photoionization of an atom, because although the separation of a negatively charge electron from the remaining positively charged ion is highly endothermic, ionization is observed to occur in conjunction with the absorption of a photon.
Slide91Light Light may also be a source of energy for driving a process that in isolation is not thermodynamically favored.
Examples:
The overall conversion of carbon dioxide to glucose through photosynthesis, for which 6CO
2(g)+6H2O(l) C6H12O6(aq)+6O2(g) has Go = +2880 kJ/molrxn
yet is observed to occur through a multistep process that is initiated by the absorption of several photons in the range of 400-700 nm.
Slide92Coupling A thermodynamically unfavorable reaction may be favorable by coupling it to a favorable reaction, such as the conversion of ATP to ADP in biological systems.
In this context, coupling means the process involves a series of reactions with common intermediates, such that the reactions add up to produce an overall reaction with a negative
G
o.
Slide93Kinetic vs. Thermodynamic Control
Slide94Spontaneous Reactions that don’t “Occur”
Many processes that are thermodynamically favored do not occur to any measurable extent, or they occur at extremely slow rates.
Sometimes, a thermodynamically favored process may not occur due to kinetic constraints
Kinetic control
Thermodynamic control
Slide95Kinetic Control
Processes that are thermodynamically favored, but do not proceed at a measurable rate, are said to be under “
kinetic control
.”
The fact that a process does not proceed at a noticeable rate does not mean that the chemical system is at equilibrium. High activation energy is a common reason for a process to be under kinetic control. Kinetic control is frequently seen at low temperatures, where meeting activation energy is problematic.
Slide96Thermodynamic Control Thermodynamic control
depends on the relative stability of the products/reactants in a reversible reaction.
At high temperatures, where activation energy will be met regardless of direction, the reaction favors the production of the more stable product.
Slide97Kinetic vs. Thermodynamic Control