
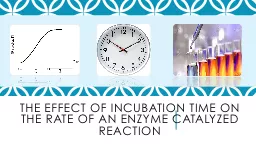
Case of Polyphenoloxidase INTRODUCTION Browning Fruits and vegetables Enzymatic Nonenzymatic Oxidation of phenolic compounds Sensory properties Color Flavor Bad Good INTRODUCTION PPO ID: 1037923
Download Presentation The PPT/PDF document "ENZYME-CATALYZED REACTIONS" is the property of its rightful owner. Permission is granted to download and print the materials on this web site for personal, non-commercial use only, and to display it on your personal computer provided you do not modify the materials and that you retain all copyright notices contained in the materials. By downloading content from our website, you accept the terms of this agreement.

1. ENZYME-CATALYZED REACTIONSCase of Polyphenoloxidase
2. INTRODUCTIONBrowning:Fruits and vegetables EnzymaticNon-enzymaticOxidation of phenolic compoundsSensory properties- Color- FlavorBadGood
3. INTRODUCTION: PPOPolyphenoloxidase (PPO): Enzyme that catalyze browning reactionExamples: Apples, avocados, lettuce, potatoes QuinonesThe reaction:Insoluble brown PolymersCu+
4. INTRODUCTIONWhat factors determine rate of enzymatic browning?Concentration of available PPOConcentration of PhenolicspHTemperatureOxygen availability
5. INTRODUCTIONHow can we control the reaction?Ascorbates, bisulfites, thiols --- Reducing agents, Reduce quinone formationEDTA, Oxalis acid, Citric Acid --- ChelatorsCitric acid, malic, phosphoric acids --- Change pH of solution
6. OBJECTIVESTo measure enzymatic activity and determine concentration dependence of an enzyme-catayzed reaction rate on substrate concentrationEvaluate influence of inhibitors
7. MATERIALPotato filtrate: being preparedSubstrate: 20mM catechol dissolved in buffer5mM ascorbic acid dissolved in bufferMethod 1: Rate of EnzymeObtain a test tube rack and small test tubes: everybody will do a duplicate of reactions!!!Follow table order
8. Method: Rate of EnzymeMaterial Volumes necessaryCatechol (mL)0.000.050.100.200.400.801.6Phosphate buffer (mL)3.002.852.82.702.502.101.30Potato filtrate (mL)0.100.100.100.100.100.100.10Total volume (mL)3.003.003.003.003.003.003.00Lab Group #1 to 71 to 71 to 71 to 71 to 71 to 71 to 7In duplicates!!!!!Prepare reaction mixtures as shownDon’t add the filtrate yet!!! - This step will be done with everybody, as we will read abs in microplate reader!!!
9. Method: Rate of EnzymeAfter everybody has mixed components, add 0.1 mL to microplate.The 0.1 mL potato filtrate will be added all at once – on everybody’s plate!!!!Prepare spectrophotometer Read blank (no enzyme). The wavelength is 395 nm. Only one blank (in duplicate) is needed for the entire series of assays. 4. Continuous assays: Record absorbance readings every 10-20 seconds/ or minutes, depending on the rate of the reaction using the microplate reader.
10. Method 2: Impact of InhibitorEffect of Ascorbic acid on PPO activityEach group will assay phenol oxidase activity in the presence of various concentrations of ascorbic acid, in duplicateMaterialVolume needed (mL)Catechol (mL)2.002.002.002.002.002.002.00Phosphate buffer (mL)0.900.880.860.820.740.580.26Ascorbate (mL):0.000.020.040.080.160.320.64Potato filtrate0.100.100.100.100.100.100.10Total volume (mL)3.003.003.003.003.003.003.00Lab Group #8 to 148 to 148 to 148 to 148 to 148 to 148 to 14Repeat same steps as for previous assaysRead on microplate reader
11. Results: Interpreting Plot the change in absorbance as a function of time, and determine the slope: + + SLOPES:- Abs/timeSLOPES =RateVelocity
12. Results: Interpreting Michaelis-MentenSlopes = Velocity – Plot a graph:X Y (V: abs/time)S4V4S3V3S2V2S1V1Y (V: abs/time)S4V4S3V3S2V2S1V1 Linearize
13. Results: Interpreting How can we work with this data?X Y (V: abs/time)S4V4S3V3S2V2S1V1Y (V: abs/time)S4V4S3V3S2V2S1V11/ 1/ VS4V4S3V3S2V2S1V11/ VS4V4S3V3S2V2S1V1 Michaelis-MentenLineweaver-Burlee
14. Results: Interpreting Lineweaver-Burlee:- From data: 1/ 1/ VS4V4S3V3S2V2S1V11/ VS4V4S3V3S2V2S1V1Y Where: y = 1/ V a=X = 1/ S b=
15. Results: Interpreting Example: - From data: V0.050.190.50.1991.00.19962.00.1998V0.050.190.50.1991.00.19962.00.1998Y 1/ 1/ V205.225.0215.010.55.0051/ V205.225.0215.010.55.005 - From data: choose a concentration from your data: S= 2.0 and V = 0.1998
16. Results: Interpreting - From M-M equation:
17. Results: Interpreting Michaelis-Menten KM and S : MolarityV: abs/ secSmall S: Slope is Vmax/KMLarge S: Saturation of enzymeV = Vmax
18. Results:Plot the change in absorbance as a function of time, and determine the slope (this is the initial reaction rate, “v”). You will need to do this for each enzyme concentration and for each ascorbate concentration.Construct a table showing initial reaction rate “v” as a function of substrate concentration, [S].Plot initial initial reaction rate “v” as a function of substrate concentration, [S] (this is the Michaelis-Menten plot). Briefly discuss your observations.From the Michaelis-Menten plot, estimate Km and Vmax.Construct a table showing initial reaction rate “v” as a function of ascorbate concentration.Plot initial reaction rate “v” as a function of ascorbate concentration. Briefly discuss your observations.
19. Visual observations:“Experiment” with the browning reactions and record your observations. Choose factors that you believe will influence therate of the reactionseverity of browningreversibility of the browningtiming of the reaction timing of reversibility of color
20. Visual observations:Expect to conduct MANY different observational trials, using about 10 mL of solution for each. Take your time and record all observations. You are on your own, so the more data you collect the better the discussion you can write. THINK about what you are doing before you do it. Create a hypothesis and experimentally test it.
21. Tool Box:A beaker and stir-bar for mixing.Buffers to control pHHydrochloric acid solution to modify pHCitric acid to modify pH and act as a metal chelatorPhosphates to act as metal chelatorsHydrogen peroxide as an oxygen sourceA hot plate to provide heatIce to provide coldAscorbic acid and/or sodium sulfite (inhibitor)Bentonite clay, as a protein binding agentSodium Borate (Borax) (inhibitor)