
Wenzel RP Edmond MB The Impact of HospitalAcquired Bloodstream Infections Emerg Infect Dis 200172174177 httpsdoiorg103201eid0702700174 ID: 1032754
Download Presentation The PPT/PDF document "Figure 1 Figure 1. Variation in..." is the property of its rightful owner. Permission is granted to download and print the materials on this web site for personal, non-commercial use only, and to display it on your personal computer provided you do not modify the materials and that you retain all copyright notices contained in the materials. By downloading content from our website, you accept the terms of this agreement.


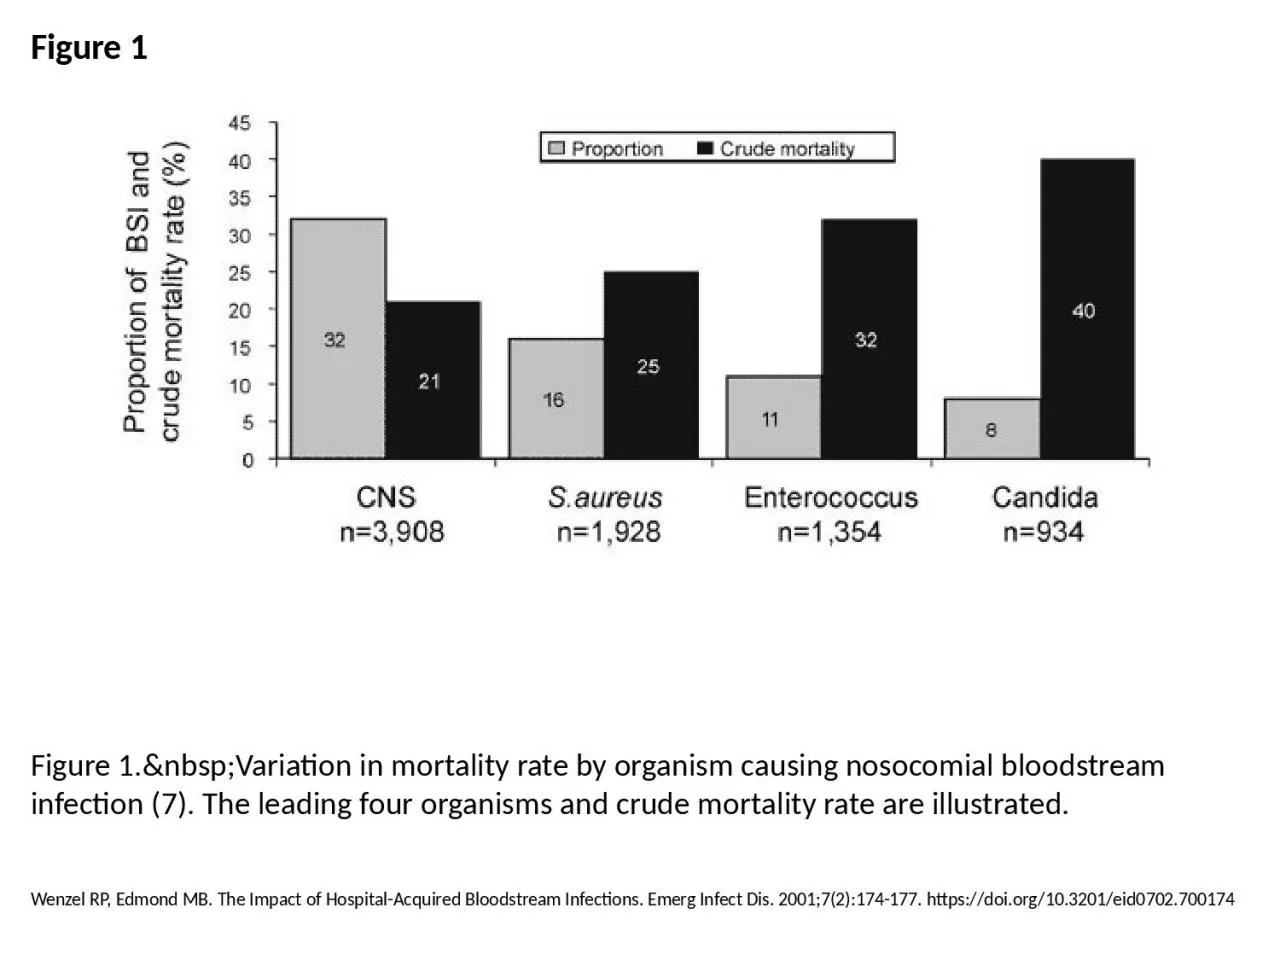
1. Figure 1Figure 1. Variation in mortality rate by organism causing nosocomial bloodstream infection (7). The leading four organisms and crude mortality rate are illustrated.Wenzel RP, Edmond MB. The Impact of Hospital-Acquired Bloodstream Infections. Emerg Infect Dis. 2001;7(2):174-177. https://doi.org/10.3201/eid0702.700174