
Training Israel November 2017 The lecture topics System background Infrastructure amp IO Products System Background INCA Integrated Nowcasting through Comprehensive Analysis Developed by ZAMG ID: 1030666
Download Presentation The PPT/PDF document "INCA Nowcasting system RTC" is the property of its rightful owner. Permission is granted to download and print the materials on this web site for personal, non-commercial use only, and to display it on your personal computer provided you do not modify the materials and that you retain all copyright notices contained in the materials. By downloading content from our website, you accept the terms of this agreement.


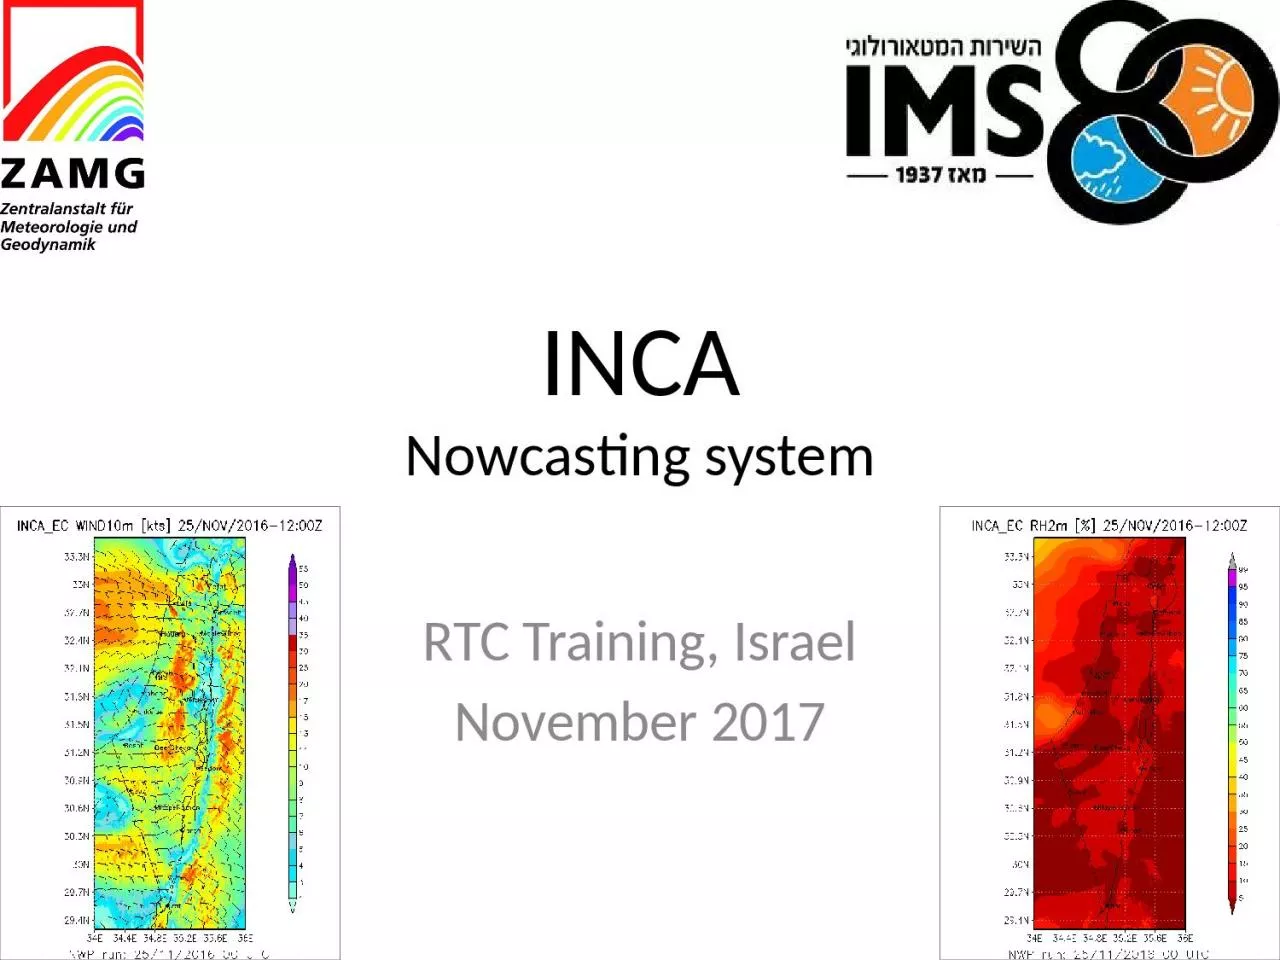
1. INCANowcasting systemRTC Training, IsraelNovember 2017
2. The lecture topics:System backgroundInfrastructure & I/OProducts
3. System Background
4. INCA – Integrated Nowcasting through Comprehensive Analysis.Developed by ZAMG: http://www.zamg.ac.at/fix/INCA_system.pdfIMS joined INCA-CE project in 2011.Operational mode since 2013 System background
5. Automatic Weather Station Observation measurementsNumerical Weather Prediction Model forecastWeather RADARMeteorological SatelliteSystem inputINCA Nowcast – short range forecastSystem outputSystem background
6. The added value of the system:High resolution and Bias correction.Nowcasting.Improvement of the short range forecast (first 6 hours) and in farther forecasting range.System background
7. NWP processing moduleTemperature & Humidity module Wind module n’th module A look “Inside” INCA Stations/RADAR/SatelliteNWPInputForecasted fieldForecasted fieldForecasted fieldSystem background
8. NWP processing moduleReads the NWP model fields and Interpolates them to INCA levels and grid:Spatial resolution: 1km/100m (Lambert Conic Conformal projection).Vertical resolution: 200m to all fields, except for wind 125m.Forecast time resolution: 10 minutes/Hourly basis. Processing includes 2D and 3D interpolation. The fields on INCA grid are being used by the system’s module to create the Nowcast. System background
9. 9Bilinear interpolation (wikipedia): considers the closest 2x2 neighborhood of known pixel values surrounding the unknown pixel's computed location. It then takes a weighted average of these 4 pixels to arrive at its final, interpolated value. The weight on each of the 4 pixel values is based on the computed pixel's distance (in 2D space) from each of the known points.http://en.wikipedia.org/wiki/Bilinear_interpolation System background
10. 10Trilinear interpolation (wikipedia): is the extension of linear interpolation, which operates in spaces with dimension D = 1, and bilinear interpolation, which operates with dimension D = 2, to dimension D = 3.http://en.wikipedia.org/wiki/Trilinear_interpolationFirst we interpolate along z (imagine we are pushing the front face of the cube to the back), giving: Then we interpolate these values (along y, as we were pushing the top edge to the bottom), giving:Finally we interpolate these values along x (walking through a line): System background
11. System background
12. System background
13. System backgroundIMS
14. TimingOutput fieldModule nameHourlyAnalysis & Forecast at 2m:Temperature, Relative Humidity, Heat Stress, Dew point Temperature, Snowfall line + freezing levelTemperature & HumidityHourlyAnalysis & Forecast at the surface(composite with satellite data)Surface TemperatureHourlyAnalysis & Forecast at 10mWindHourlyAnalysis & Forecast Wind chill10 minutesAnalysis & Forecast:Precipitation, snow, precipitation type.PrecipitationAt IMS, precipitation analysis are produced separately in operational mode, based on systems algorithm.HourlyCAPE, CIN, LCL …Analysis & Forecast (option for forecast developed by IMS)Instability indexs15 minutesAnalysis & Forecast of cloud coverCloudinessHourlyAnalysis & Forecast Icing potentialSystem background
15. The different modules take into account:physical effect of the topography.change of temperature gradient at the boundary layer.System background
16. The different modules take into account - continue:the heating/cooling of the surface during the day/night.the differences between the NWP to the Observations.Mass conservation during the wind flow.The effect of AWS one on the other.The effect of orography on precipitation… etc. System background
17. The Analysis & Forecast maps are in 1km/100m resolution.The forecast range is defined by the userFirst 6-12 hours are combination of system and NWPThe rest of the forecast range – donation of the NWP downscaled to INCA’s grid and topography System background
18. INCA forecastINCA AnalysisNWPAveraged on 88 AWS for the month of juneSystem background
19. System background
20. Infrastructure & I/O
21. Linux based system.Serial computing (in export version).Bash shell scripts wrapping c and Fortran code.At IMS graphics output is with Python and GRADS.Infrastructure & I/O
22. Infrastructure & I/O
23. Infrastructure & I/O
24. Numerical Prediction Model Input:GRIB 1 formatHourly basisAt IMS: ECMWF/COSMO2D & 3D fields: temperature, precipitation, etc.Convention: ECMWF+000.grb….ECMWF+012.grbInfrastructure & I/O
25. Automatic Weather Station Input:Hourly/10 minutesAt IMS, database mining using ad-hoc pearl script.Text file including gathered measurements from stations observation.Meta data file regarding stations: geographic location, altitude, etc.Infrastructure & I/O
26. RADAR data input:Raw dataPost processed: clutter filtering, CAPPI 1km product.5 minutes basis.Infrastructure & I/O
27. System output:ASCII filesBIL (Binary Interpolated ) files – simple binary file without header.ImagesPost-procced data: Meteograms, PDFInfrastructure & I/O
28. INCA wind module exampleInfrastructure & I/O
29. Infrastructure & I/O
30. Infrastructure & I/OThe stages of calculating wind at 10m:Reading INCA topography and land use (Surface type).Calculating f10 factor.Reading stations metadata.Getting precipitation data for effect on wind calculation – optional.Defining system levels.Calculating shaved elements.Reading data stations observations.Reading data from Radio-Sonda - optional.Reading the NWP wind fields in INCA levels and grid.
31. Infrastructure & I/OThe stages of calculating wind at 10m - continue:Finding wind differences between the NWP and stations.Finding wind differences between the NWP and Radio-Sonda - optional.Creating NWP/OBS interpolated differences map.Creating Precipitation wind effect interpolated map – optional.Adding relaxation procedure – mass conservationCreating wind at 10m adding “lake” effect.Writing modules output fields as ASCII and BIL files.
32. Infrastructure & I/Of10 factor calculation – depends on differences between the INCA and the NWP topography
33. IDW Interpolation of the NWP and station wind differences Example is taken from the temperature IDW. Same is done for the wind. Constants for wind are n=4 and c=20.(INCA_system.pdf).Infrastructure & I/O
34. Shave elements method is used for Mass conservation calculation(INCA_system.pdf).(2011_Haiden_et_al.pdf)Infrastructure & I/O
35. from DWD slide show about z coordinate system and shaved elementsInfrastructure & I/O
36. (מתוך INCA_system.pdf).Infrastructure & I/OMass Conservation
37. Infrastructure & I/OAdding the “lake” effect
38. Infrastructure & I/O
39. Infrastructure & I/OForecast is created by using weights between INCA Analysis and NWP
40. Products
41. INCA system customers:Israel Meteorological Service:Forecasting department/operation center - INCA maps, Forecast to Airfields, NWP/OBS auto-check.Research & Development department - evapotranspiration , radiation calculations.Climate departmentChemical Hazard spill applicationIsrael Hydrology Service/Water Authority INCA precipitation analysis coupled with Hydrological model.Israel fire fighters/Police/Road Safety AgencyTV channelsThe publicproducts
42. Snow case 19-20/02/2015products
43. products
44. products
45. productshttp://www.nrg.co.il/online/1/ART2/678/158.htmlGrus in Snowing “Hola” valley
46. Nowcast for Airfieldsproducts
47. products
48. Severe storm case 7/5/2014products
49. products
50. productsFrom INCA_system.pdf
51. INCA precipitation coupled to Hydrological modelproducts
52. productsהשרות ההידרולוגיAyalon Basin: division to sub-basin and flow junction in HEC-HMS hydrological model
53. productsהשרות ההידרולוגי
54. Chemical spill Hazard applicationproducts
55.
56. products
57. Summer caseproducts
58. products
59. Thank you for listening!