
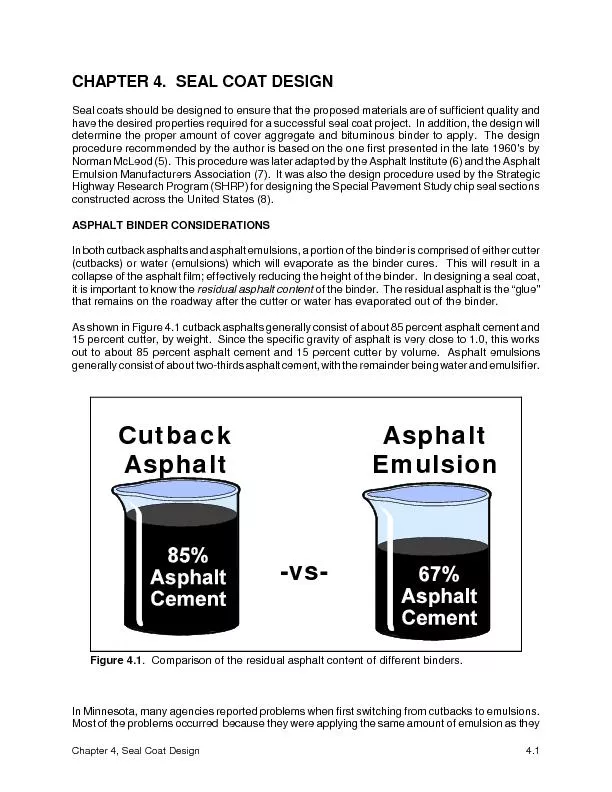
CutbackAsphalt AsphaltEmulsionvs Figure 41 Comparison of the residual asphalt content of different bindersIn Minnesota many agencies reported problems when first switching from cutbacks to emul ID: 250192
Download Pdf The PPT/PDF document "Chapter 4, Seal Coat Design4.1CHAPTER 4...." is the property of its rightful owner. Permission is granted to download and print the materials on this web site for personal, non-commercial use only, and to display it on your personal computer provided you do not modify the materials and that you retain all copyright notices contained in the materials. By downloading content from our website, you accept the terms of this agreement.


Chapter 4, Seal Coat Design4.1CHAPTER 4. SEAL COAT DESIGNSeal coats should be designed to ensure that the proposed materials are of sufficient quality andhave the desired properties required for a successful seal coat project. In addition, the design determine the proper amount of cover aggregate and bituminous binder to apply. The designprocedure recommended by the author is based on the one first presented in the late 1960's byNorman McLeod (5). This procedure was later adapted by the Asphalt Institute (6) and the AsphaltEmulsion Manufacturers Association (7). It was also the design procedure used by the StrategicHighway Research Program (SHRP) for designing the Special Pavement Study chip seal sectionsconstructed across the United States (8).ASPHALT BINDER CONSIDERATIONSIn both cutback asphalts and asphalt emulsions, a portion of the binder is comprised of either cutter(cutbacks) or water (emulsions) which will evaporate as the binder cures. This will result in acollapse of the asphalt film; effectively reducing the height of the binder. In designing a seal coat,it is important to know the residual asphalt content of the binder. The residual asphalt is the gluethat remains on the roadway after the cutter or water has evaporated out of the binder. As shown in Figure 4.1 cutback asphalts generally consist of about 85 percent asphalt cement and15 percent cutter, by weight. Since the specific gravity of asphalt is very close to 1.0, this worksout to about 85 percent asphalt cement and 15 percent cutter by volume. Asphalt emulsionsgenerally consist of about two-thirds asphalt cement, with the remainder being water and emulsifier. CutbackAsphalt AsphaltEmulsion-vs- Figure 4.1. Comparison of the residual asphalt content of different binders.In Minnesota, many agencies reported problems when first switching from cutbacks to emulsions.Most of the problems occurred because they were applying the same amount of emulsion as they 4.2Minnesota Seal Coat Handbookbeen with cutbacks. This results in approximately 20 percent less asphalt cement on thepavement curing. This lack of binder led to excessive chip loss and lack of confidence inasphalt emulsions. This problem can be avoided if the concept of residual asphalt is understood.In order for aggregate particles to remain on the roadway, they need to have approximately 70percent of their height embedded into the residual asphalt. For this to occur with an asphaltemulsion, the binder must rise near the top of the aggregate particles. This is demonstrated in theFigure 4.2. If the emulsion rises just below the top of the aggregate (voids ~100 percent filled), thevoids will be roughly two-thirds filled after curing since about one-third of the binder will evaporate.Failure to allow emulsions to rise this high will result in insufficient embedment and loss of the coveraggregate as soon as the seal coat is exposed to snow plows and traffic. Figure 4.2. Change in volume after emulsion has cured.Refer to Chapter 3 of this handbook for more details on asphalt binders used in seal coatconstruction.COVER AGGREGATE CONSIDERATIONSWhen designing a seal coat, there are several factors concerning the aggregate that must beconsidered. They all play a role in determining how much aggregate and binder should be appliedto the roadway.GradationThe gradation of the cover aggregate is important not only for determining the aggregateapplication rate but also the binder application rate. The more graded the aggregate is, the closerthe particles will be to each other on the roadway. This leaves very little room for the asphaltbinder, which can cause bleeding. The best gradation for a seal coat aggregate is one-size. This Chapter 4, Seal Coat Design4.3means that most every chip is the same size. A one-size aggregate has lots of room between theparticles for filling with the binder. In addition, inspection is much easier because each chip isembedded approximately the same amount.Particle ShapeThe shape of the aggregate particles can be round or angular, flat or cubical. Their shape determine how they lock together on the roadway. The more they lock together, the better the sealcoat is able to withstand turning and stopping of vehicles as well as damage from snow plows.Bulk Specific GravityThe specific gravity, or unit weight, of the aggregate also plays a role in determining how muchaggregate to apply to the roadway. Specific gravities of seal coat aggregate in Minnesota candiffer by as much as 20 percent. The lower the specific gravity, the lighter the aggregate. It take more pounds of a heavy aggregate, such as trap rock, to cover a square yard or meter ofpavement than it will of a light aggregate, such as limestone. Aggregate AbsorptionThe amount of binder applied to the roadway not only needs to compensate for absorption into theexisting pavement but also into the cover aggregate itself. Sedimentary aggregates such aslimestone can have ten times the absorption of igneous aggregate such as granite or trap rock.Failure to recognize this fact and correct for it can lead to excessive chips loss due to lack ofembedment.THE McLEOD DESIGN PROCEDUREIn the McLeod procedure, the aggregate application rate depends on the aggregate gradation,shape, and specific gravity. The binder application rate depends on the aggregate gradation,absorption and shape, traffic volume, existing pavement condition and the residual asphalt contentof the binder. In Minnesota, the McLeod design procedure has been modified to apply slightly more binder inorder to minimize snow plow damage in the non-wheelpath areas. This will be discussed later inthis chapter.The McLeod procedure is based on two basic principles:1.The application rate of a given cover aggregate should be determined so that the resultingseal coat will only be one-stone thick. This amount of aggregate will remain constant,regardless of the binder type or pavement condition. 2.The voids in this aggregate layer need to be 70 percent filled with asphalt cement forgood performance on pavements with moderate levels of traffic. 4.4Minnesota Seal Coat Handbook Figure 4.3. McLeod design: One-stone thick & Proper embedmentFigure 4.4 shows an inspector checking for proper chip embedment. Notice that the chip isembedded about 70 percent into the residual asphalt. This will help to ensure good chip retention. Figure 4.4. Proper embedment (~70%) into the residual asphalt.The key components of the McLeod design procedure are as follows:Median Particle SizeThe Median Particle Size (M) is determined from the gradation chart. It is the theoretical sieve sizethrough which 50 percent of the material passes (50 percent passing size). The gradation isdetermined using the following sieves: Chapter 4, Seal Coat Design4.5 Table 4.1 Sieve nest for seal coat gradationsSieveNameOpeningU.S. Customary UnitsOpeningS.I. Metric Units1 inch1.000 in.25.0 mm3/4 inch0.750 in.19.0 mm1/2 inch0.500 in.12.5 mm3/8 inch0.375 in.9.5 mm1/4 inch0.250 in.6.3 mmNo. 40.187 in.4.75 mmNo. 80.0937 in.2.36 mmNo. 160.0469 in.1.18 mmNo. 500.0117 in.300 µmNo. 2000.0029 in.75 µm Figure 4.5. Seal Coat Sieve NestFlakiness IndexThe Flakiness Index (FI) is a measure of the percent, by weight, of flat particles. It is determinedby testing a small sample of aggregate particles for their ability to fit through a slotted plate (Figure4.6). 4.6Minnesota Seal Coat HandbookThere are five slots in the plate for five different size fractions of the aggregate. If the chips canfit through the slotted plate they are considered to be flat. If not, they are considered to be cubical.The lower the Flakiness Index, the more cubical the material is. The test is run according toCentral Federal Lands Highway Division (CFLHD) DFT-508 (9).The five slots in the plate are for the following: Slot 1: Material passing the 1 in. sieve (25 mm) but retained on the 3/4 in. sieve (19 mm). Slot 2: Material passing the 3/4 in. sieve (19 mm) but retained on the 1/2 in. sieve (9.5 Slot 3: Material passing the 1/2 in. sieve (9.5 mm) but retained on the 3/8 in. sieve (6.3 Slot 4: Material passing the 3/8 in. sieve (9.5 mm) but retained on the 1/4 in. sieve (6.3 Slot 5: Material passing the 1/4 in. sieve (6.3 mm) but retained on the No. 4 sieve (4.75 Figure 4.6. Flakiness Index Testing PlateFor most seal coat aggregate in Minnesota only the smallest three slots are used. This is becausemost seal coat projects do not use 1, 3/4 or 1/2 inch (25, 19 or 12.5 mm) stone. The weight ofmaterial passing all of the slots is then divided by the total weight of the sample to give the percentflat particles, by weight, or Flakiness Index Chapter 4, Seal Coat Design4.7Average Least DimensionThe Average Least Dimension, or ALD (H), is determined from the Median Particle Size (M) andthe Flakiness Index (FI). It is a reduction of the Median Particle Size after accounting for flatparticles. It represents the expected seal coat thickness in the wheel paths where traffic forces theflat chips to lie on their flattest side.The Average Least Dimension is calculated as follows: 1.139285(0.011506)(FI) (1)Where:H=Average Least Dimension, inches or mmM=Median Particle Size, inches or mmFI=Flakiness Index, in percentLoose Unit Weight of the Cover AggregateThe loose unit weight (W) is determined according to ASTM C 29 and is needed to calculate thevoids in the aggregate in a loose condition. The loose unit weight is used to calculate the air voidsexpected between the chips after initial rolling takes. It depends on the gradation, shape, andspecific gravity of the aggregate. Well-graded aggregate and aggregate with a high dust contentwill have the highest loose unit weight because the particles pack together tightly leaving little roomfor air. This air space between the aggregate particles is the only space available to place thebinder. Figure 4.7. Loose Unit Weight Test 4.8Minnesota Seal Coat Handbook Voids in the Loose AggregateThe voids in the loose aggregate (V) approximate the voids present when the chips are droppedfrom the spreader onto the pavement. Generally, this value will be near 50 percent for one-sizeaggregate, less for graded aggregate. After initial rolling, the voids are assumed to be reduced to30 percent and will reach a low of about 20 percent after sufficient traffic has oriented the stoneson their flattest side. However, if there is very little traffic, the voids will remain near 30 percent andthe seal coat will require more binder to ensure good chip retention. One of the following equationsis used to calculate the voids in the loose aggregate: U.S. Customary Units: 62.4G (2)Where:V=Voids in the Loose Aggregate, in percent expressed as a decimalW=Loose Unit Weight of the Cover Aggregate, ASTM Method C 29, lbs/ftG=Bulk Specific Gravity of the AggregateS.I. Metric Units: 1000G (3)Where:V=Voids in the Loose Aggregate, in percent expressed as a decimalW=Loose Unit Weight of the Cover Aggregate, ASTM Method C 29, kg/mG=Bulk Specific Gravity of the AggregateBulk Specific GravityDifferent aggregates have different specific gravities or unit weights. This value must be taken intoaccount in the design procedure because it will take more pounds of a heavy aggregate to covera square yard of pavement than it will for a light aggregate. Table 4.2 can be used as a guidelinefor determining the specific gravity of typical seal coat aggregates in Minnesota.Table 4.2. Typical Bulk Specific Gravity of Common Seal Coat Aggregates in Minnesota Aggregate typeClass AClass BClass CGraniteQuartziteTrapRockLimestoneRed RockPea RockBulkSpecificGravityMin.2.602.592.952.402.502.55Max.2.752.632.982.672.522.66Avg.2.682.622.972.612.512.62Aggregate Absorption Chapter 4, Seal Coat Design4.9 Most aggregates absorb some of the binder applied to the roadway. The design procedure mustbe able to correct for this condition to ensure enough binder will remain on the pavement surface.Table 4.3 can be used as a guideline. A good rule of thumb is that Class A aggregates generallydo not require a correction for absorption, whereas Class B and C aggregates generally do.McLeod suggests an absorption correction factor, A, of 0.02 gal/yd (0.09 L/m) if the aggregateabsorption is around 2 percent. The author recommends using this correction if the absorption is1.5 percent or higher.Table 4.3. Typical Absorption of Common Seal Coat Aggregates in Minnesota Aggregate typeClass AClass BClass CGraniteQuartziteTrapRockLimestoneRed RockPea RockPercentAbsorptionMin.0.400.610.311.75no data1.14Max.0.920.720.595.44no data2.32Avg0.590.670.432.80-1.69Traffic VolumeThe traffic volume on the pavement surface, in terms of the number of vehicles per day, plays arole in determining the amount of asphalt binder needed to sufficiently embed the chips. Generallyspeaking, the higher the traffic volume, the lower the binder application rate. At first glance thismay not seem correct. However, remember that traffic forces the chips to lay on their flattest side.Consequently, the greater the traffic volume the greater the chance the chips will be laying on theirflat side. If a roadway had no traffic, the chips would be laying in the same orientation as whenthey were first rolled during construction. As a result, they would stand taller and need moreasphalt binder to achieve the desired 70 percent embedment. With enough traffic, the chips be laying as flat as possible causing the seal coat to be as thin as possible. If this is not taken intoaccount, the wheelpaths will likely bleed. The McLeod design procedure uses Table 4.4 toestimate the required embedment, based on the number of vehicles per day on the roadway.Table 4.4. Traffic Correction Factor, TTraffic Factor The percentage, expressed as a decimal, of the ultimate 20 percent void space in the coveraggregate to be filled with asphaltTraffic - Vehicles per dayUnder0.850.750.700.650.60Note: The factors above do not make allowance for absorption by the road surface or by absorptive coveraggregate. Traffic Whip-Off 4.10Minnesota Seal Coat Handbook The McLeod procedure also recognizes that some of the cover aggregate will get thrown to theside of the roadway be passing vehicles as the fresh seal coat is curing. The amount of aggregatethat will do this is related to the speed and number of vehicles on the new seal coat. To accountfor this, a traffic whip-off factor (E) is included in the aggregate design equation. A reasonablevalue to assume is 5 percent for low volume, residential type traffic and 10 percent for higher speedroadways such as county roads . The traffic whip-off factor is shown in Table 4.5. Table 4.5. Aggregate Wastage Factor, E (Source: Asphalt Institute MS-19, March 1979)Percentage WasteAllowed ForWastage Factor, E11.0121.0231.0341.0451.0561.0671.0781.0891.09101.10111.11121.12131.13141.14151.15 Due to traffic whip-off and handlingExisting Pavement ConditionThe condition of the existing pavement plays a major role in the amount of binder required to obtainproper embedment. A new smooth pavement with low air voids will not absorb much of the biapplied to it. Conversely, a dry, porous and pocked pavement surface can absorb a tremendousamount of the binder. Failure to recognize when to increase or decrease the binder application rateto account for the pavement condition can lead to excessive chip loss or bleeding. The McLeodprocedure uses the descriptions and factors in Table 4.6 to add or reduce the amount of binderto apply in the field. Chapter 4, Seal Coat Design4.11 Table 4.6. Surface Correction Factor, SExisting Pavement TextureCorrection, SS.I. Metric (L/m)U.S. Customary (gal/ydBlack, flushed asphalt-0.04 to - 0.27-0.01 to -0.06Smooth, non-porous0.000.00Slightly porous & oxidized+0.14+0.03Slightly pocked, porous & oxidized+0.27+0.06Badly pocked, porous & oxidized+0.40+0.09The inspector needs to be aware of these conditions should they change at some point throughoutthe project. Most agencies seal roadways built during different years by different contractors with differentmaterials as part of a single contract. Included may be new pavements, old pavements, porouspavements, flushed pavements, etc. For this reason, it is not practical to assume that allroadways to be sealed in a given project will need the same amount of asphalt binder.Examples of some of these pavement conditions are shown in Figures 4.8 to 4.11. Figure 4.8. Example of a smooth, non-porous surface 4.12Minnesota Seal Coat Handbook Figure 4.9. Example of a slightly porous and oxidized surface. Figure 4.10. Example of a slight pocked, porous and oxidized surface. Chapter 4, Seal Coat Design4.13 Figure 4.11. Example of a badly pocked, porous and oxidized surface.McLEOD SEAL COAT DESIGN EQUATIONSOnce all of the lab testing is completed, the following equations are then used to determine theaggregate and binder application rates. While the results may need to be adjusted in the field,especially the binder application rate, they have shown to provide a close approximation of thecorrect quantity of materials.Aggregate Design EquationThe aggregate application rate is determined from the following equations:U.S. Customary Units:46.8(10.4V)HGE (4)Where:C=Cover Aggregate Application Rate, lbs/ydV=Voids in the Loose Aggregate, in percent expressed as a decimalH=Average Least Dimension, inchesG=Bulk Specific Gravity of the AggregateE=Wastage Factor for Traffic Whip-Off (Table 4.5) 4.14Minnesota Seal Coat HandbookS.I. Metric Units:0.4V)HGE (5)Where:C=Cover Aggregate Application Rate, kg/mV=Voids in the Loose Aggregate, in percent expressed as a decimalH=Average Least Dimension, mmG=Bulk Specific Gravity of the AggregateE=Wastage Factor for Traffic Whip-Off (Table 4.5)Binder Design EquationBinder application rates are determined from the following equations:U.S. Customary Units: (2.244)(H)(T)(V) (6)Where:B=Binder Application Rate, gallons/ydH=Average Least Dimension, inchesT=Traffic Factor (based on expected vehicles per day, Table 4.4)V=Voids in Loose Aggregate, in decimal percent (Equation 2)S=Surface Condition Factor, gal/yd (based on existing surface, Table 4.6)A=Aggregate Absorption Factor, gallons/ydR=Residual Asphalt Content of Binder, in percent expressed as a decimal.S.I. Metric Units: (0.40)(H)(T)(V) (7)Where:B=Binder Application Rate, liters/mH=Average Least Dimension, mmT=Traffic Factor (based on expected vehicles per day, Table 4.4)V=Voids in Loose Aggregate, in decimal percent (Equation 3)S=Surface Condition Factor, liters/m (based on existing surface, Table 4.6)A=Aggregate Absorption Factor, liters/mR=Residual Asphalt Content of Binder, in percent expressed as a decimal.One additional calculation has been made to the McLeod design to account for snow plow damage.After the binder design equation is done using the ALD, it is recalculated using the Median ParticleSize in place of the ALD. This will give the binder required if none of the chips lay flat. Theaverage of these two values is then used as the starting point for the field test sections discussedin Chapter 5 of this manual. It has been found that if this is not done, insufficient binder will existin the non-traffic areas and snow plows will shave off the stones in these areas.The following example is given to demonstrate how to use the design equations to determinebinder and cover aggregate application rates. Chapter 4, Seal Coat Design4.15 SEAL COAT DESIGN EXAMPLEA 150 pound (68 kg) sample if an FA-3 granite seal coat aggregate has been submitted for design.The traffic on the road to be sealed is 850 vehicles per day. The pavement surface is slightlypocked, porous and oxidized. The binder will be a CRS-2 emulsion with 67% residual asphalt.Step 1:Determine the aggregate gradation, bulk specific gravity and percent absorptionGradation results:SieveNameSieve OpeningPercent PassingU.S. CustomaryS.I. Metric1/2 inch0.50 in.12.5 mm1003/8 inch0.375 in.9.5 mm921/4 inch0.25 in.6.3 mm85No. 40.187 in.4.75 mm18No. 80.0937 in.2.36 mm6No. 160.0469 in.1.18 mm3No. 500.0117 in.300 µm1No. 2000.0029 in.75 µm0.4Based on AASHTO T 84-94 the bulk specific gravity of was determined to be 2.71Based on AASHTO T 84-94 the aggregate absorption was determined to be 0.3 percent.Step 2.Determine the Median Particle SizeThe gradation results in the table above are then plotted on a gradation chart. The Median ParticleSize is determined by extending a horizontal line at the 50 percent passing mark until it intersectsthe gradation curve. A vertical line is then projected downward which gives the Median ParticleSize. This is the theoretical size where half of the stones are larger and half smaller. It isconsidered to be theoretical because there may not actually be any stones that size. 4.16Minnesota Seal Coat Handbook Figure 4.12. Gradation Chart for the Design Example showing the Median Particle Size.Step 3.Determine the Flakiness Index (FI)The aggregate used to determine the gradation is then broken down into the following fractions:(1) Passing the 1 in. sieve but retained on the 3/4 in. sieve; (2) Passing the 3/4 in. sieve but retained on the ½ in. sieve;(3) Passing the ½ in. sieve but retained on the 3/8 in. sieve;(4) Passing the 3/8 in. sieve but retained on the 1/4 in. sieve and (5) Passing the 1/4 in. sieve but retained on the No. 4 sieveSince all of the material passed the ½ in. sieve, only the last three fractions are used. Theaggregate particles in each fraction are tested to see if they fit through the slotted plate (Figure4.6). The results are shown in the next table. Chapter 4, Seal Coat Design4.17 Flakiness Index Test ResultsSize FractionWeight Retained on Slot(grams)Weight Passing Slot(grams)1/2 to 3/8 in.54.212.33/8 to 1/4 in.123.343.51/4 in. to No. 4184.489.5Totals361.90145.3The Flakiness Index is calculated as follows: (WeightofFlatChips)(WeightofSample) (145.3)(361.90145.3) (145.3)(507.2)28.6percent (8)Step 4. Determine the Average Least Dimension (H)The Average Least Dimension, or ALD, is the expected thickness of the seal coat in the wheelpathsafter any flat chips have been oriented on their flattest side by traffic. It is calculated from theMedian Particle Size (M) and the Flakiness Index (FI) as follows:U.S. Customary Units: 1.139285(0.011506)(FI) 0.215in.1.139285(0.011506)(28.6)0.146inches (9)S.I. Metric Units: 1.139285(0.011506)(FI) 5.50mm1.139285(0.011506)(28.6)3.75mm (10)Step 5. Determine the Loose Weight of the Aggregate (W)A metal cylinder with a volume of 0.50 ft (0.014 m) was loosely filled with aggregate until full asshown in Figure 4.7. The weight of the aggregate was then determined. This was repeated threetimes with the results in the following table. The average of the three is then used to determine theLoose Unit Weight of the aggregate. 4.18Minnesota Seal Coat Handbook Loose Unit Weight Test ResultsTest NumberWeight of the Aggregate in the Cylinder(Lbs)Weight of theAggregate in the Cylinder(kg)145.2520.57245.3220.60345.2920.59Average45.2920.59The Loose Unit Weight (W) is calculated as follows:U.S. Customary Units WeightofaggregateVolumeofcylinder 45.29lbs0.50ft90.58lbs/ft (11)S.I. Metric Units WeightofaggregateVolumeofcylinder 20.59kg0.014m1,471kg/m (12)Step 6. Determine the Voids in the Loose Aggregate (V)Using Equations 13 and 14, the voids in the loose aggregate are calculated. The higher the voids,the more room for the asphalt binder and the more one-size the aggregate is.U.S. Customary Units: 62.4G 90.58lbs/ft(62.4)(2.71)0.46 (13)S.I. Metric Units: 1000G 1,471kg/m(1000)(2.71)0.46 (14)Since 0.46 is fairly close to 0.50, this is a fairly one-size aggregate. Chapter 4, Seal Coat Design4.19 Summarizing the above information:TestU.S. Customary UnitsS.I. Metric UnitsMedian Particle Size0.215 inches5.50 mmFlakiness Index28.6 percent28.6 percentAverage Least Dimension0.146 inches3.75 mmLoose Unit Weight90.58 lbs/ft1,470 kg/mVoids in the LooseAggregate0.460.46Traffic Volume500 - 1000 vehicles/dayUse 5% whip-off 500 - 1000 vehicles/dayUse 5% whip-offSurface ConditionSlightly pocked, porous andoxidizedSlightly pocked, porous andoxidizedBulk Specific Gravity2.712.71Aggregate Absorption0.31 percentNo adjustment needed0.31 percentNo adjustment neededResidual Asphalt Content ofthe Binder0.670.67Cover Aggregate Application RateU.S. Customary Units:46.8(10.4×V)(H)(G)(E)46.8(10.4×0.46)(0.146in.)(2.71)(1.05)15.8lbs/yd (15)Where:C=Cover Aggregate Application Rate, lbs/ydV=Voids in the Loose Aggregate, in percent expressed as a decimalH=Average Least Dimension, inchesG=Bulk Specific Gravity of the AggregateE=Wastage Factor for Traffic Whip-Off (Table 4.5)S.I. Metric Units:0.4×V)(H)(G)(E)0.4×0.46)(3.75mm)(2.71)(1.05)8.7kg/m (16)Where:C=Cover Aggregate Application Rate, kg/mV=Voids in the Loose Aggregate, in percent expressed as a decimalH=Average Least Dimension, mmG=Bulk Specific Gravity of the AggregateE=Wastage Factor for Traffic Whip-Off (Table 4.5) 4.20Minnesota Seal Coat HandbookThe recommended results should be rounded up to the nearest pound or kilogram. Once theaggregate application rate has been determined it is a good idea to test it. This is done byspreading the recommended amount of aggregate over a one square yard (or one square meter)plywood box. The aggregate should provide a one-stone thick layer. This will provide a representation of how the seal coat should look in the field. In the field, the aggregateapplication rate does not need to be adjusted to account for traffic or surfondition asdoes the binder.Binder Design EquationThe binder application rate is determined from the following equations:U.S. Customary Units: (2.244)(H)(T)(V) (17)Where:B=Binder Application Rate, gallons/ydH=Average Least Dimension, inchesT=Traffic Factor (based on expected vehicles per day, Table 4.4)V=Voids in Loose Aggregate, in decimal percent (Equation 2)S=Surface Condition Factor, gal/yd (based on existing surface, Table 4.6)A=Aggregate Absorption Factor, gallons/ydR=Residual Asphalt Content of Binder, in decimal percentBinder Application Rate for Wheelpaths: (2.244)(0.146in.)(0.70)(0.46)0.060.000.670.25gal/yd (18)This application rate should provide proper embedment of the chips once they have laid on theirflattest side. In Minnesota, it is recommended that the binder application rate for non-traffic areasalso be calculated and the average of the two be used as the starting point in the field. This isdone by substituting the Median Particle Size for the Average least Dimension.Binder Application Rate for non-wheelpath areas: (2.244)(0.215in.)(0.70)(0.46)0.060.000.670.32gal/yd (19)Take the average of the two as the starting point in the field:StartingApplicationRateintheField 0.250.320.29gal/yd (20)S.I. Metric Units: (0.40)(H)(T)(V) (21) Chapter 4, Seal Coat Design4.21Where:B=Binder Application Rate, liters/mH=Average Least Dimension, mmT=Traffic Factor (based on expected vehicles per day, Table 4.4)V=Voids in Loose Aggregate, in decimal percent (Equation 3)S=Surface Condition Factor, liters/m (based on existing surface, Table 4.6)A=Aggregate Absorption Factor, liters/mR=Residual Asphalt Content of Binder, in decimal percent.Application rate in the wheelpaths: (0.40)(3.75mm)(0.70)(0.46)0.27L/m0.000.671.12L/m (22)The binder application rate in the non-traffic areas is: (0.40)(5.50mm)(0.70)(0.46)0.27L/m0.000.671.46L/m (23)Once again, take the average as a starting point in the field.StartingApplicationRateintheField 1.461.121.29L/m (24)SUMMARYIn summary, a good seal coat design incorporates many factors of the binder and aggregate. Theresults should yield a good starting point for field test sections. Experience has shown that theaggregate application rate determined from the equations is almost always the correct rate to applyin the field. However, since the binder application rate makes assumptions concerning the amountof texture and porosity of the existing pavement, the binder application rate will almost always to be adjusted. Most of the time it will need to be adjusted upward (apply more binder).A good tool to use in the field is a binder adjustment chart. This type of chart calculates the designapplication rate for all combinations of traffic (Table 4.4) and surface condition (Table 4.6). It canbe used by the inspector to make adjustments in the field. Figure 4.13 shows the binderadjustment chart for the above example. 0.20 0.22 0.24 0.26 0.28 0.30 0.32 0.34 0.36 Binder Application Rate (Gal/SY) Binder Application Rate, CRS-2FA-3 GraniteSlightly porous,& oxidizedSlightly pocked, porous,& oxidizedBadly pocked,porous,& oxidizedOver2,0001,000to2,000500to1,000100to500Under100 Traffic Volume(ADT)PavementCondition 60%65%70%75%85% Figure 4.13. Example of a Binder Adjustment Chart4.22Minnesota Seal Coat Handbook