
5 things you must know MDC212 Charles Clarke Veeam Ana Gabriela Hernandez Microsoft Session Objectives Understand useful metrics Get the best from System Center path of least resistance ID: 357206
Download Presentation The PPT/PDF document "Monitor VMware in System Centre" is the property of its rightful owner. Permission is granted to download and print the materials on this web site for personal, non-commercial use only, and to display it on your personal computer provided you do not modify the materials and that you retain all copyright notices contained in the materials. By downloading content from our website, you accept the terms of this agreement.


Slide1
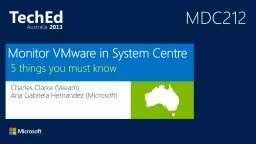
Monitor VMware in System Centre
5 things you must know
MDC212
Charles Clarke (Veeam)
Ana Gabriela Hernandez (Microsoft) Slide2
Session Objectives
Understand useful metricsGet the best from System
Center (path of least resistance)Slide3
Agenda
Options for VMware monitoringWhy use System Centre?
Discovery
Key
metrics
Trending and Analysis
Capacity Planning
Automation
5Slide4
SC 2012 Operations Manager investments
Topology simplification
Network monitoring
Linux/Unix authoring
OM manageability
Scale Improvement (50%)
Extensible dashboards
.NET Application Performance Monitoring
JEE Monitoring
DevOps
Experience
Fabric and WorkloadsSlide5
SP1 Investments
Virtual fabric monitoring
Storage monitoring
New Linux distributions
360 dashboards
DevOps scenarios
Global Service Monitor
Enhanced APM: WCF, MVC, .NET Windows services, IIS8
DevOps
Experience
Fabric and WorkloadsSlide6
R2 Investments
360 Fabric Monitoring
Better integration with VMM
Improved Azure Monitoring
Improved Management Packs
Advisor Attach including support for Fabric components
Improving dashboard performance
New Widgets*
Java APM
Enhanced
Intellitrace
integration
Enhanced TFS integration
DevOpsExperience
Fabric and Workloads
*delivery/scope TBDSlide7
Now to vSphere in System Center…Slide8
VMware vSphere monitoring options
vCenterAgent in the VMSNMPSyslog
VMware Web Service SDK (API)Slide9
Why System Center 2012 for
VMware
(01) Private cloud and Service Deployment
(02) VMware is widely deployed Hypervisor
(03) End to End Monitoring for VMware and Microsoft workloads
(04) Heterogeneous Hypervisor Management and Automation
(05) System Center 2012 is
THE management product for Microsoft
based workloadsSlide10
System Center Operations Manager
What needs monitored -
Database layer -
Application Layer -
Presentation Layer -
- Monitoring Console
Notifications
Reporting
Management Server
OpsMgr Agents
OpsMgr Database
Data Warehouse
Management PacksSlide11Slide12
5
key concepts for monitoring virtualization
You need a mapTrack relationships & dependencies
Visualize as you virtualize
Dashboards & Reports. Context is key
Everybody has to share
Understand resource sharing and over-commitment
Look to the future
Use forecasting, trending, modelling
Knowledge is power
KB guidance is essential for lower time-to-resolutionSlide13
Key events: Availability and configuration
Availability and Status
VMsHosts
Storage
Network
HardwareSlide14
Demo
VMware maps in System CenterSlide15
5
Key concepts for monitoring virtualization
You need a map
Track relationships & dependencies
Visualize as you virtualize
Dashboards & Reports. Context is key
Everybody has to share
Understand resource sharing and over-commitment
Look to the future
Use forecasting, trending, modelling
Knowledge is power
KB guidance is essential for lower time-to-resolutionSlide16
Key metrics : Compute CPU
CPU Usage
CPU Used, <90%CPU Ready, <15%CPU Co-Stop, <15 %
Relate Host usage to
VMs
usageSlide17
Key metrics : Compute Memory
Memory Usage
Memory Used, <90%Memory Balloon, <50%
Can cause high disk I/O in-VM due to paging
Memory Swapping, = 0!
Swapfile
use is last resort for the Host
Relate Host usage to VMs usageSlide18
Key metrics : Storage
Storage space
Disk Pressure is a factor!Minimum free space >100 MB
At this point VM corruption will occur
Also track ‘garbage/unknown’ files
Also track Snapshots
Relate VMs to
DatastoresSlide19
Key metrics : Storage
Storage spaceStorage Latency
Kernel Latency within Host ~0ms
Device Latency on backend <20ms
Find the hotspots of high I/O
Relate VMs to
DatastoresSlide20
Demo
VMware visualisation in SCOMSlide21
5
Key concepts for monitoring virtualization
You need a map
Track relationships & dependencies
Visualize as you virtualize
Dashboards & Reports. Context is key
Everybody has to share
Understand resource sharing and over-commitment
Look to the future
Use forecasting, trending, modelling
Knowledge is power
KB guidance is essential for lower time-to-resolutionSlide22
Key metrics : Over-commitment
CPU Pressure
# of running VM
vCPU
per Host Core
High ratio can impact vSphere CPU Scheduler
Absolute maximum = 25
Best practice 4 - 8Slide23
Key metrics : Over-commitment
CPU PressureMemory Pressure
Memory allocated versus physical RAM available
vSphere shares very efficiently (TPS) – but:
High values can cause ballooning, or even swappingSlide24
Key metrics : Over-commitment
CPU PressureMemory Pressure
Disk Pressure
Disk space allocated versus capacity
No real performance impact – but:
If VMs start to use their allocation – physical capacity can fill quicklySlide25
Demo
Key relational metricsSlide26
5
Key concepts for monitoring virtualization
You need a map
Track relationships & dependencies
Visualize as you virtualize
Dashboards & Reports. Context is key
Everybody has to share
Understand resource sharing and over-commitment
Look to the future
Use forecasting, trending, modelling
Knowledge is power
KB guidance is essential for lower time-to-resolutionSlide27
Key Factors
Pressure metrics
CapacityAlert trending
‘What if’ and ‘where’?Slide28
Demo
Capacity planning and forecastingSlide29
5
Key concepts for monitoring virtualization
You need a map
Track relationships & dependencies
Visualize as you virtualize
Dashboards & Reports. Context is key
Everybody has to share
Understand resource sharing and over-commitment
Look to the future
Use forecasting, trending, modelling
Knowledge is power
KB guidance is essential for lower time-to-resolutionSlide30
Knowledge is power
SCOM kb guidance is vitalMean-time-to-resolutionProactive automated managementSlide31
Demo
Knowledge Base and AutomationSlide32
Q&ASlide33
Related content
Breakout
Session
Three
Ways to extend Hyper-V Data Protection with
Veeam
Thursday 5
th
Sept at 3.00pm – 3.30pm in the expo
Product Demo Stations
(
booth – 21
and 12)Related Certification Exam - VMTSPFind Me Later At the BoothSlide34
Thank youSlide35
Developer Network
Resources for Developers
http://
msdn.microsoft.com
/en-au/
Learning
Virtual Academy
http://www.microsoftvirtualacademy.com/
TechNet
Resources
Sessions on Demand
http://channel9.msdn.com/Events/
TechEd
/Australia/2013Resources for IT Professionalshttp://technet.microsoft.com/en-au/Slide36
© 2013 Microsoft Corporation. All rights reserved. Microsoft, Windows and other product names are or may be registered trademarks and/or trademarks in the U.S. and/or other countries.
The information herein is for informational purposes only and represents the current view of Microsoft Corporation as of the date of this presentation. Because Microsoft must respond to changing market conditions, it should not be interpreted to be a commitment on the part of Microsoft, and Microsoft cannot guarantee the accuracy of any information provided after the date of this presentation. MICROSOFT MAKES NO WARRANTIES, EXPRESS, IMPLIED OR STATUTORY, AS TO THE INFORMATION IN THIS PRESENTATION.