
Please Send Title Seoyoon Cho Sumit Kar Jose Sanchez Yue Pan David Bang Dhruv Patel Wei Gu Bohan Li Siqi Xiang Nicolas Wolczynski Mingyi ID: 784199
Download The PPT/PDF document "Participant Presentations" is the property of its rightful owner. Permission is granted to download and print the materials on this web site for personal, non-commercial use only, and to display it on your personal computer provided you do not modify the materials and that you retain all copyright notices contained in the materials. By downloading content from our website, you accept the terms of this agreement.


Slide1
Participant Presentations
Please Send Title:
Seoyoon
Cho
Sumit
Kar
Jose
Sanchez
Yue
Pan
David
Bang
Dhruv
Patel
Wei
Gu
Bohan
Li
Siqi
Xiang
Nicolas
Wolczynski
Mingyi
Wang
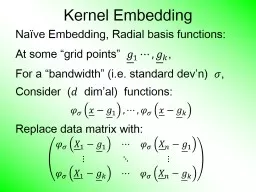
Slide2Kernel Embedding
Na
ï
ve Embedding, Radial basis functions:At some “grid points” ,For a “bandwidth” (i.e. standard dev’n) ,Consider ( dim’al) functions:Replace data matrix with:
Slide3Kernel Embedding
Toy Example 4: Checkerboard
Radial
BasisEmbedding+ FLDIsExcellent!
Slide4Kernel PCA
Toy
Example: Raw Data
Long StretchedClusterRound ClustersOutliers?Small Cluster?
Slide5Kernel PCA
1
st
ComponentFinds CoarseScale Green vs. Blues
Slide6Kernel PCA
2
nd
ComponentSeparatesBlue & CyanStrongLocality!
Slide7Kernel PCA
3
rd
ComponentSplitsGreens
Slide8Kernel PCA
Why Not More Widely Used?
Needs
Visualization in Clever Solution:t-SNE Visualizationt-distributed Stochastic Neighbor EmbeddingMaaten & Hinton (2008)
Slide9t-SNE Visualization
Main Idea:
Data
Kernel SpaceMDS Type Representers
Gaussian KernelTransformation
Cauchy Kernel
Transformation
Induces KernelPCA Type Locality
Pushes
AwayFarther Points
Optimization: Make
Close As Possible
Slide10t-SNE Visualization
Same Toy
Example4(?) QuiteDiverseClusters
Slide11t-SNE Visualization
Perplexity = 30 (Default)
Keeps LocalStructureBut GlobalRearangement
And
OutlierCluster is Split
Slide12Support Vector Machines
Motivation:
Find a linear method that
“works well”for embedded dataNote: Embedded data are very non-GaussianSuggests value ofreally new approach
Slide13Support Vector Machines
Graphical View, using Toy Example:
Slide14Support Vector Machines
Graphical View, using Toy Example:
Find
separating planeTo maximize distances from data to planeIn particular smallest distanceData points closest are called support vectors Gap between is called margin Caution: For some “margin” is different
Slide15SVMs, Optimization Viewpoint
Get classification function:
Choose Class:
+1, when -1, when
Note: linear function of
i.e. have found separating
hyperplane
Slide16SVMs, Computation
Major Computational Point:
Classifier only depends on data through
inner products!
Slide17SVMs, Comput
’
n & Embedding
For an “Embedding Map”, e.g. Explicit Embedding:Maximize:
Get classification function:
Straightforward application of embedding
But
loses
inner product advantage
Slide18SVMs,
Comput
’
n & EmbeddingImplicit Embedding:Maximize: Note Difference from Explicit Embedding
:
Slide19SVMs, Comput
’
n & Embedding
Implicit vs. Explicit Embedding:Still defined only via inner productsRetains optimization advantageThus used very commonlyComparison to explicit embedding?Which is “better”??? Explored in Schölkopf & Smola (2002)Via Mercer’s Theorem
Slide20SVMs, Tuning Parameter
Recall Regularization Parameter C:
Controls penalty for violation
I.e. lying on wrong side of planeAppears in slack variablesAffects performance of SVMStudy Toy Example: , Spherical Gaussian data
Slide21SVMs, Tuning Parameter
Toy Example:
,
Sph’l Gaussian data
Slide22SVMs, Tuning Parameter
Toy Example:
,
Sph’l Gaussian data
Called
Hard Margin
SVM
Thus Less Generalizable(For This Data Set)
For Large Values of C
Lots of Data Piling
Large Angle to Optimal
Slide23SVMs, Tuning Parameter
Toy Example:
,
Sph’l Gaussian data
Slide24SVMs, Tuning Parameter
Toy Example:
,
Sph’l Gaussian data
For Small Values of C
Smaller Angle to Optimal
No Apparent Data Piling
So
More Generalizable
Connection to MD?
Add MD Axis to Plot
Slide25SVMs, Tuning Parameter
Toy Example:
,
Sph’l Gaussian dataPut MD on horizontal axis
Note:
For C Small
SVM
Dir’n = = MD Dir’n
Slide26SVMs, Tuning Parameter
Toy Example:
,
Sph’l Gaussian dataPut MD on horizontal axis
For Large Values of C
SVM
not
MD
Yet Same for Small C!
(For This Data Set)
Hard Margin SVM
Clearly Different
Slide27SVMs, Tuning Parameter
Toy Example:
,
Sph’l Gaussian dataMathematics Behind This:Carmichael & Marron (2017) Small C in General: Trimmed Mean Small Range Between That & Hard Margin Established Useful Bounds on Ends
Slide28Support Vector Machines
Important Extension:
Multi-Class SVMs
Hsu & Lin (2002)Lee, Lin, & Wahba (2002) Defined for “implicit” version“Direction Based” variation???
Slide29Support Vector Machines
SVM Tuning Parameter Selection:
Joachims
(2000)Wahba et al. (1999, 2003)
Slide30Distance Weighted Discrim
’
n
Improvement of SVM for HDLSS DataToy e.g. indep. (similar toearlier movie)
Slide31Distance Weighted Discrim
’
n
Toy e.g.: Maximal Data Piling Direction- Perfect Separation- Gross Overfitting- Large Angle- Poor Gen’ability
MDP
Feels Small Scale
Noise Artifacts
Slide32Distance Weighted Discrim
’
n
Toy e.g.: Support Vector Machine Direction- Bigger Gap- Smaller Angle- Better Gen’ability- Feels support vectors too strongly???- Ugly subpops?- Improvement?
Similarly Feels Small
Scale Noise Artifacts
Slide33Distance Weighted Discrim
’
n
Toy e.g.: Distance Weighted Discrimination- Addresses these issues- Smaller Angle- Better Gen’ability- Nice subpops- Replaces min dist. by avg. dist.
Slide34Distance Weighted Discrim
’
n
Based on Optimization Problem:For “Residuals”:
Slide35Distance Weighted Discrim
’
n
Based on Optimization Problem:Uses “poles” to push plane away from data
Slide36Distance Weighted Discrim
’
n
Based on Optimization Problem:More precisely: Work in appropriate penalty for violationsOptimization Method:Second Order Cone Programming“Still convex” gen’n of quad’c program’gAllows fast greedy solutionCan use available fast software(SDP3, Michael Todd, et al)
Slide37Distance Weighted Discrim
’
n
References for more on DWD:Main paper:Marron, Todd and Ahn (2007)Links to more papers:Ahn (2006)R Implementation of DWD:CRAN (2014)SDPT3 Software:Toh et al (1999)Sparse DWD: Wang & Zou (2016)
Slide38Distance Weighted Discrim
’
n
References for more on DWD:Faster Version:Lam et al. (2018)Robust (Against Heterogeneity) Version:Wang & Zou (2016)
Will Discuss
More Later
Approach:
three-block
semiproximal alternating
direction method ofmultipliers
Slide39Distance Weighted Discrim
’
n
2-d Visualization:Pushes PlaneAway FromDataAll PointsHave SomeInfluence(not just support vectors)
Slide40Distance Weighted Discrim
’
n
Caution:Early DWD Versions Assumed (Balanced Sampling)Improved Version:Qiao et al. (2010) Also Includes Arbitrary Class Priors
If Not, Cutoff
Is Wrong,
Can Give Poor Results
Slide41Support Vector Machines
Graphical View, using Toy Example:
Slide42Support Vector Machines
Graphical View, using Toy Example:
Slide43Distance Weighted Discrim
’
n
Graphical View, using Toy Example:
Slide44HDLSS
Discrim
’n SimulationsMain idea: Comparison ofSVM (Support Vector Machine)DWD (Distance Weighted Discrimination)MD (Mean Difference, a.k.a. Centroid)Linear versions, across dimensions
Slide45HDLSS
Discrim
’n SimulationsOverall Approach:Study different known phenomenaSpherical GaussiansOutliersPolynomial EmbeddingCommon Sample SizesBut wide range of dimensions
Slide46HDLSS
Discrim
’n SimulationsCriterion for Comparison:Based on 100 Simulated ExperimentsEach had Training DataAssessed with Test Data PointsRecorded Misclassification Proportion
Slide47HDLSS
Discrim
’n SimulationsSpherical Gaussians:
Slide48HDLSS
Discrim
’n SimulationsSpherical Gaussians:Same setup as beforeMeans shifted in dim 1 only, All methods pretty goodHarder problem for higher dimensionSVM noticeably worseMD best (Likelihood method)DWD very close to MDMethods converge for higher dimension??
Slide49HDLSS
Discrim
’n SimulationsOutlier Mixture:
Slide50HDLSS
Discrim
’n SimulationsOutlier Mixture:80% dim. 1 , other dims 020% dim. 1 ±100, dim. 2 ±500, others 0MD is a disaster, driven by outliersSVM & DWD are both very robustSVM is bestDWD very close to SVM (insig’t difference)Methods converge for higher dimension??Ignore RLR (a mistake)
Slide51HDLSS
Discrim
’n SimulationsWobble Mixture:
Slide52HDLSS
Discrim
’n SimulationsWobble Mixture:80% dim. 1 , other dims 020% dim. 1 ±0.1, rand dim ±100, others 0MD still very bad, driven by outliersSVM & DWD are both very robustSVM loses (affected by margin push)DWD slightly better (by w’ted influence)Methods converge for higher dimension??Ignore RLR (a mistake)
Slide53HDLSS
Discrim
’n SimulationsNested Spheres:
Slide54HDLSS
Discrim
’n SimulationsNested Spheres:1st d/2 dim’s, Gaussian with var 1 or C2nd d/2 dim’s, the squares of the 1st dim’s(as for 2nd degree polynomial embedding) Each method best somewhereMD best in highest d (data non-Gaussian)Methods not comparable (realistic)Methods converge for higher dimension??HDLSS space is a strange placeIgnore RLR (a mistake)
Slide55HDLSS
Discrim
’n SimulationsConclusions: Everything (sensible) is best sometimesDWD often very near bestMD weak beyond GaussianCaution about simulations (and examples):Very easy to cherry pick best onesGood practice in Machine Learning“Ignore method proposed, but read paper for useful comparison of others”
Every Dog Has his Day
Slide56HDLSS
Discrim
’n SimulationsCaution: There are additional playersE.g. Regularized Logistic Regression looks also very competitiveInteresting Phenomenon: All methods come together in very high dimensions???
Slide57HDLSS
Discrim
’n SimulationsCan we say more about: All methods come together in very high dimensions???Mathematical Statistical Question:Mathematics behind this???
Slide58Batch and Source Adjustment
Important Application
o
fDistance Weighted Discrimination
Slide59Batch and Source Adjustment
For Stanford Breast Cancer Data
From Perou et al (2000)
Microarray for Measuring Gene Expression Old Style: Arrays Printed in Lab
Slide60Batch and Source Adjustment
For Stanford Breast Cancer Data
From Perou et al (2000)
Analysis in Benito et al (2004) Adjust for Source EffectsDifferent sources of mRNA Adjust for Batch EffectsArrays fabricated at different times
Slide61Idea Behind Adjustment
Early Approach: Alter et al (2000)
Squash Out
PC1 directionEliminates variation in that direction
Slide62DWD: Why not PC1?
PC 1 Direction feels
variation
, not classes Also eliminates (important?) within class variation
Slide63DWD: Why not PC1?
Direction driven by
classes
“Sliding” maintains (important?) within class variation
Slide64E. g. even worse for PCA
PC1 direction is worst possible
Slide65But easy for DWD
Since DWD uses class label information
Slide66Batch and Source Adjustment
Try Out Real Data:
Stanford Breast Cancer Data
From Perou et al (2000) “Intrinsic” Genes Breast Cancer PatientsDiscovered With Clustering: Subtypes
Slide67Source Batch
Adj
: Raw Breast Cancer data
Slide68Source Batch
Adj
: Source Colors
Slide69Source Batch
Adj
: Batch Colors
Slide70Source Batch
Adj
: Biological Class Colors
Slide71Source Batch
Adj
: Biological Class Col. & Symbols
Slide72Source Batch
Adj
: Biological Class Symbols
Slide73Source Batch
Adj
: Source Colors
Slide74Source Batch
Adj
: PC 1-3 & DWD direction
Slide75Source Batch
Adj
: DWD Source Adjustment
Slide76Source Batch
Adj
: Source
Adj’d, PCA view
Slide77Source Batch
Adj
: Source
Adj’d, Class Colored
Slide78Source Batch
Adj
: Source
Adj’d, Batch Colored
Slide79Source Batch
Adj
: Source
Adj’d, 5 PCs
Slide80Source Batch
Adj
: S.
Adj’d, Batch 1,2 vs. 3 DWD
Slide81Source Batch
Adj
: S. & B1,2 vs. 3 Adjusted
Slide82Source Batch
Adj
: S. & B1,2 vs. 3
Adj’d, 5 PCs
Slide83Source Batch
Adj
: S. & B
Adj’d, B1 vs. 2 DWD
Slide84Source Batch
Adj
: S. & B
Adj’d, B1 vs. 2 Adj’d
Slide85Source Batch
Adj
: S. & B
Adj’d, 5 PC view
Slide86Source Batch
Adj
: S. & B
Adj’d, 4 PC view
Slide87Source Batch
Adj
: S. & B
Adj’d, Class Colors
Slide88Source Batch
Adj
: S. & B
Adj’d, Adj’d PCA
Slide89Participant Presentation
Bryce Rowland:
NMF for Hi-C
Data Thomas Keefe: Haar Wavelet Bases Feng Cheng: Magnetic Resonance Fingerprinting