
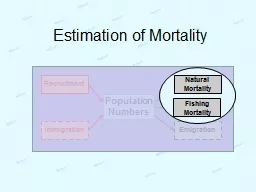
Recruitment Immigration Emigration Population Numbers Natural Mortality Fishing Mortality Catch Curves 2 Recall Discrete Population Growth Model N t1 1r N t where r bdie ID: 530481
Download Presentation The PPT/PDF document "Estimation of Mortality" is the property of its rightful owner. Permission is granted to download and print the materials on this web site for personal, non-commercial use only, and to display it on your personal computer provided you do not modify the materials and that you retain all copyright notices contained in the materials. By downloading content from our website, you accept the terms of this agreement.


Slide1
Estimation of Mortality
Recruitment
Immigration
Emigration
Population
Numbers
Natural Mortality
Fishing MortalitySlide2
Catch Curves
2Recall
Discrete Population Growth ModelNt+1 = (1+r)Ntwhere r = b-d+i-eSuppose that …
… population is closed… following the same group of fishThus, r = -d but d is usually replaced with AA is the annual mortality rateSolve for ASlide3
Catch Curves
3Mortality Rate Concept
For example, N1 = 1000 and N2 = 850.What is the mortality rate?What is the survival rate?
S is an annual survival rateNote that A+S = 1Such that S=1-A or A=1-SSlide4
Catch Curves
4Instantaneous Mortality Rate (Z)
Similarly examine continuous model …r = -d but replace d with Z such that Nt+1 = Nte-Zsolve for Z
thus, Z is an instantaneous mortality rateNote that S=e-Z and A = 1-e-ZSlide5
Catch Curves
5Two Problems
Population sizes are not usually “seen.”Z can be computed from CPEs Recall that Ct = qftN
tAlgebraically show that Z=log(CPEt)-log(CPEt+1)Catches or CPEs are subject to variabilityCatches are
samples; Z is, thus, a statistic.If a cohort is followed over time, individual estimates of Z can be made and averaged.Slide6
Catch Curves
6Example Calculations
IDEAL REALt Nt Ct Ct*0 1000 200 211
1 800 160 1592 640 128 1263 512 102 1044 410 82 815 328 66 64
Calculate Z from each time step of …population sizes.
idealistic catches.realistic catches.composite (average) of realistic catches.Slide7
Catch Curves
7Catch Curve
LongitudinalCatch-at-age for a single cohort of fish.Cross-sectionalCatch-at-age in a single year (across many cohorts of fish).Slide8
Catch Curves
8
Longitudinal vs. Cross-Sectional
Catch-at-age across several capture years.
Capture Year
Age
2009 2010 2011 2012 2013 2014 2015 20160 200 200 200 200 200 200 200 200
1 160 160 160 160 160 160 160 1602 128 128 128 128 128 128 128 1283 102 102 102 102 102 102 102 1024 82 82 82 82 82 82 82 82
5 66 66 66 66 66 66 66 66What is the cross-sectional catch-at-age for 2012?
What is the longitudinal catch-at-age for the 2010 year-class?Longitudinal=cross-sectional
if Z and N0 are constant across time and cohorts.Slide9
Catch Curves
9Catch Curve Model
Recall: CPEt = qNt and N
t = N0e-ZtSubstitute second into first … CPEt = qN0
e-ZtCan this be linearized?What is estimate of Z?
0
1
2
3
4
5
80
120
160
200
Age / Time
CPESlide10
Catch Curves
10Catch Curve Characteristics
Fit regression of log(CPE) on age only for ages on descending limb.
0
2
4
6
8
10
0.5
1.0
1.5
2.0
2.5
3.0
3.5
4.0
Age / Time
log(CPE)
Asc
Dome
Descending
-Z
1
-Z
1Slide11
Catch Curve Analysis in R
Examine HandoutcatchCurve()
summary()confint()
Catch Curves11Slide12
Catch Curves
12Catch Curve Assumptions
Population closed to immigration and emigration.Z is constant.q is constant“Sample” is unbiased regarding any age-group (i.e., be careful of selective gears
)Accurate agesFollow a cohort (if longitudinal CC used)
Recruitment on descending limb is constant (if cross-sectional CC used)