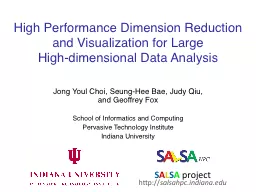
Highdimensional Data Analysis Jong Youl Choi SeungHee Bae Judy Qiu and Geoffrey Fox School of Informatics and Computing Pervasive Technology Institute Indiana University S A ID: 135426
Download Presentation The PPT/PDF document "High Performance Dimension Reduction and..." is the property of its rightful owner. Permission is granted to download and print the materials on this web site for personal, non-commercial use only, and to display it on your personal computer provided you do not modify the materials and that you retain all copyright notices contained in the materials. By downloading content from our website, you accept the terms of this agreement.
Slide1
High Performance Dimension Reduction and Visualization for Large High-dimensional Data Analysis
Jong Youl Choi, Seung-Hee Bae, Judy Qiu, and Geoffrey FoxSchool of Informatics and ComputingPervasive Technology InstituteIndiana University
S
A
LSA project
http://
salsahpc.indiana.eduSlide2
Navigating Chemical Space
1Christopher Lipinski, “Navigating chemical space for biology and medicine”, Nature, 2004Slide3
Data Visualization
Visualize high-dimensional data as points in 2D or 3D by dimension reductionDistances in target dimension represent similarities in original dataInteractively browse dataEasy to recognize clusters or groupsAn example of chemical data (PubChem)Visualization to display disease-gene relationship, aiming at finding cause-effect relationships between disease and genes.
2Slide4
MotivationData is getting larger and high-dimensional
PubChem : database of 60M chemical compounds Each compound is represented by multiple features or fingerprint (166, 320, or 880 bit long)Fast and efficient visualization is neededChemical space visualization is used for early stage of drug-discovery research (e.g., pre-screening, …)Dimension reduction algorithms are computation- and memory-intensive algorithmParallelization to utilize a distributed memoryReduce memory requirement per processIncrease computational speed3Slide5
Generative Topographic Mapping
An algorithm for dimension reduction Latent Variable Model (LVM)Define K latent variables (zk)Map K latent points to the data space by using a non-linear function fConstruct maps of data points in the latent space
K latent pointsN data points
4Slide6
EM optimizationFind K centers for N data
K-clustering problem, known as NP-hardUse Expectation-Maximization (EM) methodEM algorithmFind local optimal solution iteratively until convergeE-step:M-step:5Slide7
Parallel GTM
K latent pointsN data
points
1
2
A
B
C
1
2
A
B
C
Finding K clusters for N data points
Relationship is a bipartite graph (bi-graph)
Represented by K-by-N matrix (K << N)
Decomposition for P-by-Q compute grid
Reduce memory requirement by 1/PQ
6
Example:
A 8-byte double precision matrix for N=100K and K=8K requires 6.4GBSlide8
Multi-Dimensional ScalingPairwise dissimilarity matrix
N-by-N matrixEach element can be a distance, rank, etc., … Given Δ, find a map in a target dimensionCriteria (or objective function)STRESSSSTRESSSMACOF is one of algorithms to solve MDS problem7Slide9
Parallel MDS
Decomposition for P-by-Q compute gridReduce memory requirement by 1/PQ8A
B
C
A
B
C
Example:
A 8-byte double precision matrix for N=100K requires 80GBSlide10
GTM vs. MDS9
GTMMDS (SMACOF)Maximize Log-Likelihood
Minimize STRESS or SSTRESS
Objective
FunctionO(KN) (K << N)
O(N
2
)
Complexity
Non-linear dimension reduction
Find an optimal configuration in a lower-dimension
Iterative optimization method
Purpose
EM
Iterative
Majorization
(EM-like)
Optimization
MethodSlide11
MDS and GTM Map (1)
10PubChem data with CTD visualization by using MDS (left) and GTM (right)About 930,000 chemical compounds are visualized as a point in 3D space, annotated by the related genes in Comparative Toxicogenomics
Database (CTD)Slide12
MDS and GTM Map (2)11
Chemical compounds shown in literatures, visualized by MDS (left) and GTM (right)Visualized 234,000 chemical compounds which may be related with a set of 5 genes of interest (ABCB1, CHRNB2, DRD2, ESR1, and F2) based on the dataset collected from major journal literatures which is also stored in Chem2Bio2RDF system. Slide13
Experiment Environments12Slide14
Parallel GTM using 128 cores 13
10,000
PubChem
dataset
20,000 PubChem datasetSlide15
Parallel MDS using 128 cores
14
10,000
PubChem
dataset20,000 PubChem datasetSlide16
Canonical Correlation Analysis
15
Maximum correlation = 0.90
GTM
MDSSlide17
ConclusionDeveloped parallel GTM and MDS to process large- and high-dimensional dataset
100,000 chemical compounds in PubChem database have been processedCompared MDS and GTM map16Slide18
Thank you
Question?Email me at jychoi@cs.indiana.edu
17Slide19
18
multiple ring system
>1 aliphatic oxygen joined to a ring