
Presenter name JeanPaul ZOYEM Presenter title SPC consultant Welfare Economist Pacific Regional Conference on Poverty analysis methods 03 to 06 April 2023 Tanoa International Hotel Nadi ID: 1012364
Download Presentation The PPT/PDF document "Poverty line and poverty indexes" is the property of its rightful owner. Permission is granted to download and print the materials on this web site for personal, non-commercial use only, and to display it on your personal computer provided you do not modify the materials and that you retain all copyright notices contained in the materials. By downloading content from our website, you accept the terms of this agreement.

1. Poverty line and poverty indexes Presenter name: Jean-Paul ZOYEMPresenter title: SPC consultant – Welfare EconomistPacific Regional Conference on Poverty analysis methods03 to 06 April 2023Tanoa International Hotel, Nadi, FijiPACSTAT project (P169122): Statistical Innovation and Capacity Building in the Pacific Island Countries
2. AgendaThe Cost of Basic Needs (CBN) approachProcess chart of the CBNWell-beingConsumption adjusted for spatial and temporal cost (deflators)Consumption adjusted for household composition (per capita & per adult equivalent)Poverty lineReference householdsFood basketFood poverty line (FPL)Non-food poverty line (NFPL)Basic Need Poverty Line (BNPL)Poverty indexesPoverty ratePoverty gapSquare poverty gap
3. Process chart of the CBN approachMain pillars of the CBN approachConsumption aggregatePoverty line
4.
5. Well-beingAdjustment of the consumption aggregateDefinitionsCapita=number of individuals in the householdAE= Adult equivalentConsumption adjusted for price differencesConsumption deflated= Consumption / DeflatorConsumption adjusted for household size and composition Consumption per capita= Consumption (deflated) / CapitaConsumption per adult equivalent= Consumption (deflated) / AE
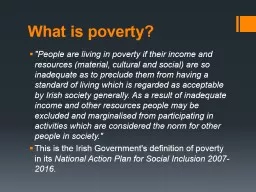
6. Definition of Poverty linePoverty line is defined as the level of consumption under which an individual is considered poor.Poverty line in the CBN approachPoverty line is The minimum consumption necessary for the satisfaction of basic needsFood poverty line (FPL) = Minimum food consumption necessary to be alive and conduct physical activityNon-food poverty line (NFPL) = Minimum money necessary to satisfy non-food basic needs (clothing, housing, health, education, transport, leisure, etc)Basic needs poverty line (BNPL)= Food poverty line + Non-food poverty lineChallenge of poverty line computation = estimate the minimum needs
7. Food poverty line computationWhat is the monetary value of the needed minimum food consumption?What is the needed minimum food consumption?Which foods do poor consume? (food basket of the poor)At which price? (cost of a kcal)Poor population is not known A proxi= Reference populationFood basket of reference population= A proxi of those of the poor in terms of structure and items prices
8. Food poverty line computationThe needed minimum food consumptionDefined as the minimum dietary energy requirements (kcal)Nutritional value and healthiness of the food are not taken into accountMinimum energy requirements in the PICTsMost of the time poverty analyses in the PICTs fixe the threshold at 2100 kcal/capita/dayMinimum energy requirements in Tonga 2021Not enough information to estimate the national minimum calorie intakeThe threshold of 2100 kcal was used
9. Food poverty line computationReference populationSelect households that are in the deciles of consumption distribution around the poverty lineRefer to the poverty lines of previous periodsIterate the process to fix a robust reference populationReference population in the PICTSTBD: Tabulate selected cases
10. Food poverty line computationReference populationTonga 2021Previous poverty rate estimated at 22,5% in 2009Reference population for Tonga 2021 [11,35]Iteration on intervals of consumption per AE distributions[06, 30], [06, 35], [06, 40],[11, 30], [11, 35], [11, 40]
11. Food poverty line computationFood basketThe Food basket describes the composition of the consumption of the reference population Amount of the total food consumptionShare of each food item in the total consumptionAll the food items are potentially included in the food basket:Except those that do not have enough data for the calculation of the cost of calorie consumed by the householdFAFH may not have some useful data for the calculation of the cost of calorie (quantity, price per unit, etc);PSMB recommends to allow special treatment to FAFH
12. Food poverty line computationFood basketIn practice, only the most important consumptions are included in the food basketThe biggest consumption represented 90% of the total amount are generally considered as representative of the whole food consumption using the following process:Calculate the total consumption of the reference households,Calculate the share of each item in the totalRank items by decreasing shareSelect the items that represent the 90% biggest shares Tonga 2021Food basket= 59 products representing he biggest consumption represented 90% of the total amount are generally considered as representative of the whole food consumption using the following process:
13. Food poverty line computationFood basket
14. Food poverty line computationFood basket (continued)
15. Food poverty line computationFood basket: FAFHTwo main approaches to converting the amount of FAFH into calorie equivalent Incorporate a food establishment survey into the HIES data collection.Collect the composition of common restaurant and street vendor meals by location, which are then converted into calories.Use information from food prepared and consumed at homeCalculate the per-calorie cost of food prepared and consumed at home and apply a multiplier,Making assumption that the per-calorie cost of FAFH is the same as or a multiple of the per-calorie cost of food prepared and consumed at home, and that the composition of food eaten in restaurants is similar to that prepared at homePSMB recommends to adopt a multiplier of 1.25
16. Food poverty line computationCalculation of the cost of kcal of in-house food consumptionLimit the food basket to in-house food consumptionCalculate the kcal equivalent of each item using:Kcal per 100 grammesQuantity (grammes)Adjust for non-edible share of the productDerive the cost of a kcal of in-house food consumption (kcal_inh) using:Money amount, andKcal equivalentTonga 2021: kcal_inh_cost =0.00282522Calculate the kcal cost of FAFH using the multiplier: Kcal_FAFH_cost=1,25*0.00282522= 0,0035315
17. Food poverty line computationCalculation of the value of 2100 kcalCome back to the full food basket including FAFHCalculate the kcal equivalent of FAFH usingMoney amount of FAFH items, and the Kcal cost of FAFH (kcal_fafh)Deduce the kcal structure of the food basket by:Calculating the item kcal Share in the food basket (kcal_share)Deduce the kcal contribution of an item to the 2100 kcal (item_kcal2100= kcal_share*2100) by applying to 2100 kcal the item kcal share;Deduce the cost of 2100 kcal as the sum of kcal contribution of items weighted by their kcal cost : Val_kcal2100=sum(item_kcal2100 * kcal_cost)Annual Food poverty line (FPL)=365*Val_kcal2100Tonga 2021: FPL= TOP2,881
18. Computation approachesNon-food poverty line is constructed using the relationship between food and non-food spending of the reference population.This construction is supported by the main idea that the non-food component of poverty line is the non-food share of total spending by households whose food spending is close to the food poverty line.Several approaches are used to calculate the non-food component of the poverty line, among which:Regression method based on an Engel curve. It uses econometrics models to predict the shape of the curve describing the relationship between food spending and consumption. Ravallion non-parametric approaches: they use the spending patterns of the households around the food poverty line to estimate the non-food share of the poverty line.It is not rare that different approaches come to different values of poverty line,Nonfood poverty line computation
19. Nonfood poverty line computationNon-food component of the poverty line: Ravallion non-parametric approachesRavallion upper bound poverty line that uses per adult equivalent food consumption around the food poverty line and proceed as follows:Step 1: Obtain average total per adult equivalent consumption for households whose per adult equivalent food consumption is +/- 1% of the food poverty line.Step 2: Repeat for households around +/- 2%, continuing up to +/- 10%.Step 3: Take average of all averages as the estimate of the non-food component of the total poverty line.Ravallion lower bound poverty line that uses per adult equivalent total consumption around the food poverty line and proceed as follows:Step 1: Obtain average total per adult equivalent consumption for households whose per adult equivalent total consumption is +/- 1% of the food poverty line.Step 2: Repeat for households around +/- 2%, continuing up to +/- 10%.Step 3: Take average of all averages as the estimate of the non-food component of the total poverty line.
20. Nonfood poverty line computationFood poverty line (FPL) is at the vertical dash black line ($2881)HHs with food consumption around the FPL are at crossing point with food consumption distribution (around the 20th percentile poorest) Used for Ravallion upper boundHHs with food consumption around the FPL are at crossing point with total consumption distribution (around the one percentile poorest) Used for Ravallion lower boundNFPL is expected to be higher with Ravallion upper bound.
21. Nonfood poverty line computationTonga 2021Basic Need Poverty Line (Tonga 2021)Reference population11 to 35 percentile Food poverty lineRegression methodRavallion Upper boundRavallion Lower boundPoverty line288147436256No household fit the criteriaPoverty rate1,03%6,14%20,71%
22. Poverty indexesMonetary poverty measures commonly include a set of three measures:Poverty Headcount that is the proportion of the population living below the poverty line.Poverty Gap that is the average shortfall, as expressed as a percentage of the poverty line.Squared Poverty Gap that measures the gap to poverty line in giving more weight to those living farer to poverty line.Poverty indexes in the family of FGT measures Foster, Greer & Thorbecke (1984) defined the formula : where z is the poverty line, is the lowest consumption (or other standard of living indicator),n is the total population,q is the number of persons who are poor, andα is a “poverty aversion” parameter.
23. Poverty indexesFGT measures Defined the most common set of measures used in poverty analysis (Foster, Greer & Thorbecke in 1984).where z is the poverty line, is the lowest consumption (or other standard of living indicator),n is the total population,q is the number of persons who are poor, andα is a “poverty aversion” parameter.
24. Poverty indexesFGT are a family of measures as the α takes different values (𝛼 ≥ 0)α valueFGT poverty indexesNaming of the measureCharacteristic of the measureα = 0 Poverty rateIncidence of povertyα = 1Poverty gapDepth / Intensity of povertyα = 2 * ()Squared Poverty gapSeverity of povertyα valueFGT poverty indexesNaming of the measureCharacteristic of the measureα = 0 Poverty rateIncidence of povertyα = 1Poverty gapDepth / Intensity of povertyα = 2 Squared Poverty gapSeverity of poverty
25. Poverty indexes of Tonga by regionPoverty indexes by region in Tonga
26. Thank youAddress/post: Pacific Community (SPC), 95 Promenade Roger Laroque, BP D5 98848 Noumea, New Caledonia Phone: +687 262000 | Fax: +687 263818 | Email: complaints@spc.int | Web: https://spc.int/accountability