
Houseman C Hughes GJ Chapman KE Wilson D Gorton R Increased Invasive Pneumococcal Disease North East England UK Emerg Infect Dis 2017231122126 httpsdoiorg103201eid2301160897 ID: 1045331
Download Presentation The PPT/PDF document "Figure 2 Figure 2. Trends in incidence o..." is the property of its rightful owner. Permission is granted to download and print the materials on this web site for personal, non-commercial use only, and to display it on your personal computer provided you do not modify the materials and that you retain all copyright notices contained in the materials. By downloading content from our website, you accept the terms of this agreement.


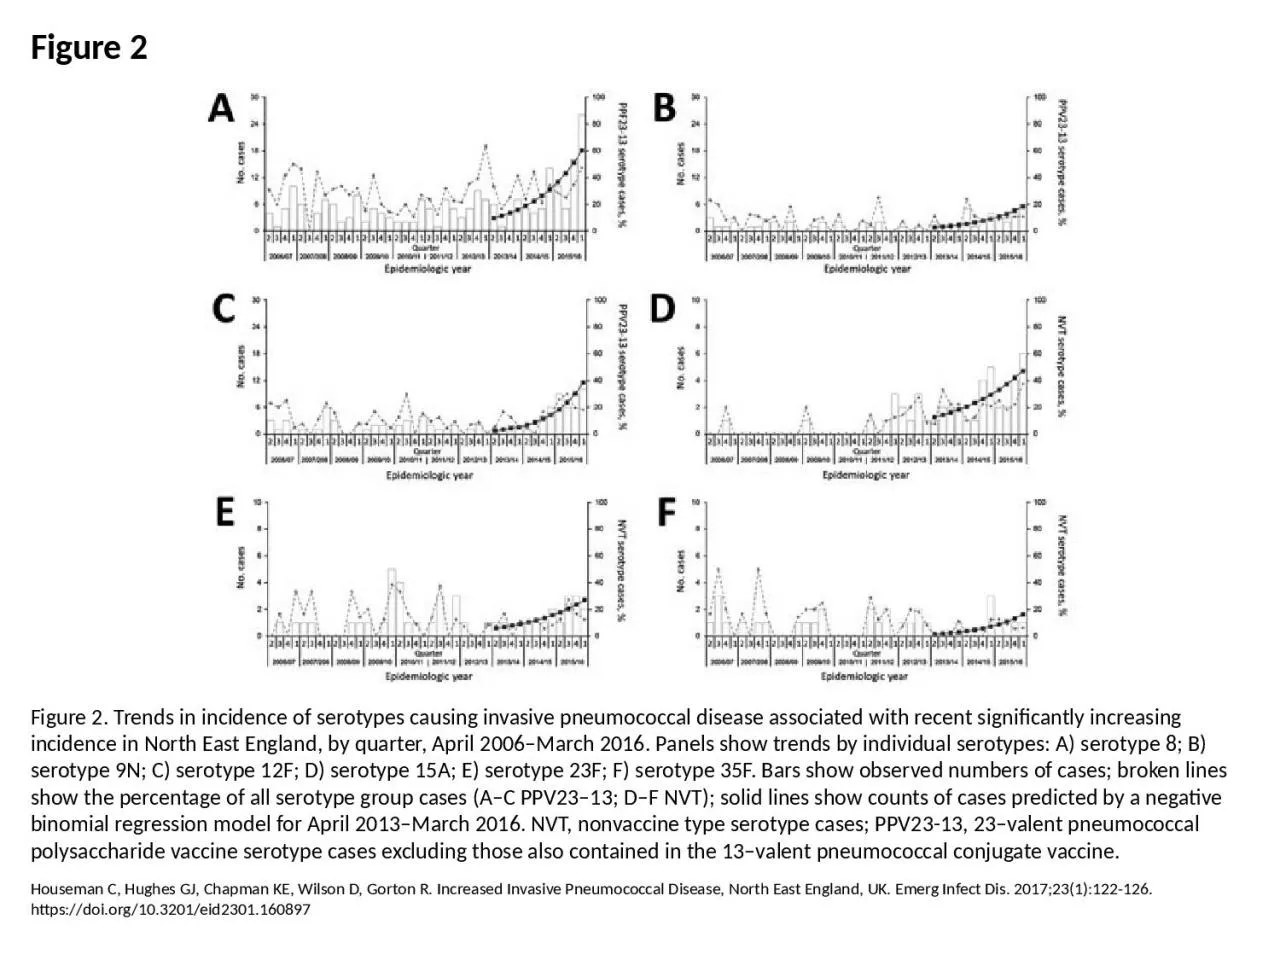
1. Figure 2Figure 2. Trends in incidence of serotypes causing invasive pneumococcal disease associated with recent significantly increasing incidence in North East England, by quarter, April 2006–March 2016. Panels show trends by individual serotypes: A) serotype 8; B) serotype 9N; C) serotype 12F; D) serotype 15A; E) serotype 23F; F) serotype 35F. Bars show observed numbers of cases; broken lines show the percentage of all serotype group cases (A–C PPV23–13; D–F NVT); solid lines show counts of cases predicted by a negative binomial regression model for April 2013–March 2016. NVT, nonvaccine type serotype cases; PPV23-13, 23–valent pneumococcal polysaccharide vaccine serotype cases excluding those also contained in the 13–valent pneumococcal conjugate vaccine.Houseman C, Hughes GJ, Chapman KE, Wilson D, Gorton R. Increased Invasive Pneumococcal Disease, North East England, UK. Emerg Infect Dis. 2017;23(1):122-126. https://doi.org/10.3201/eid2301.160897