

2 BROADENING PARAMETERS IN THE n 9 BAND OF ETHANE C 2 H 6 CURTIS P RINSLAND NASA Langley Research Center Hampton VA USA V MALATHY DEVI amp D CHRIS BENNER The College of William and Mary Williamsburg VA USA ID: 1007039
Download Presentation The PPT/PDF document "LINE POSITIONS, INTENSITIES, SELF- AND N" is the property of its rightful owner. Permission is granted to download and print the materials on this web site for personal, non-commercial use only, and to display it on your personal computer provided you do not modify the materials and that you retain all copyright notices contained in the materials. By downloading content from our website, you accept the terms of this agreement.

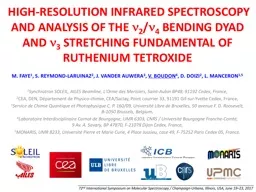


1. LINE POSITIONS, INTENSITIES, SELF- AND N2-BROADENING PARAMETERS IN THE n9 BAND OF ETHANE (C2H6)CURTIS P. RINSLAND(NASA Langley Research Center, Hampton, VA, USA.)V. MALATHY DEVI & D. CHRIS BENNER(The College of William and Mary, Williamsburg, VA, USA.)ROBERT L. SAMS &THOMAS A. BLAKE(Pacific Northwest National Laboratory, Richland, Washington, USA.)
2. Ethane is an important molecule in the atmospheres of the Earth, Titan and giant planets, and comets.Spectra from outer solar system bodies of Jupiter, Saturn, Neptune and Titan show 12 mm emission features from ethaneFor retrieving abundance determinations from these planetary atmospheres its strongest & the sharpest Q branch (RQ0) is usually used.We measured spectroscopic line parameters, such as,accurate line positionsabsolute line intensitiesself- and N2-broadened width coefficients in several PQ and RQ sub band regions.To accomplish this, 17 high-resolution room-temperature absorption spectra (Six self- and Eleven N2-broadened) are fit simultaneously using a multispectrum nonlinear least squares fitting algorithm.
3. Spectra were recorded at ~0.002 cm-1 using the Bruker IFS 120 HR FTS at PNNL~110 spectra (Background, Calibration, Single channel, transmission) were obtainedData were recorded at various temperatures (+ 24 - -65oC) and pressures using 2 different absorption paths (~3.2 m & 20 cm)A multispectrum fitting technique was used to fit all the data simultaneously in specific wavenumber intervals (e.g. to include a sub band)Constraints were written to retrieve intensities and Lorentz half width coefficients (for torsional-split components). Separations between the two torsional-split components were adjusted (when appropriate) during fittings.Results from analyzing 17 room-temperature spectra will be reported for the following sub bands. PQ(J,3), PQ(J,2), PQ(J,1), RQ(J,0), RQ(J,1), RQ(J,2) and RQ(J,3)
4.
5.
6.
7.
8.
9.
10.
11.
12.
13.
14.
15.
16.
17.