

November 15 2018 Tracer Test SlugDose Method Reactor Series of tanks connected at top and bottom Filling Volume 75000 Gallons 10 x 7500 Gal Common filling header Total Connected Volume 149000 Gallons ID: 780883
Download The PPT/PDF document "North Gualala CA2310007 Tracer Study" is the property of its rightful owner. Permission is granted to download and print the materials on this web site for personal, non-commercial use only, and to display it on your personal computer provided you do not modify the materials and that you retain all copyright notices contained in the materials. By downloading content from our website, you accept the terms of this agreement.


Slide1
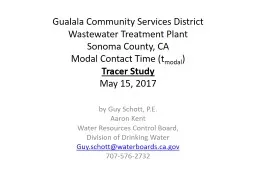
North GualalaCA2310007Tracer StudyNovember 15, 2018
Tracer Test: Slug-Dose MethodReactor: Series of tanks connected at top and bottomFilling Volume: 75,000 Gallons (10 x 7,500 Gal)Common filling headerTotal Connected Volume: 149,000 Gallons(16 x 7,500 gal + 2 x 10,000 gal + 2 x 4,500 gal)Baffles: NonePerformed by:Guy Schott, P.E.CA Division of Drinking Water
Slide2Table of Content
Slide3North Gualala Water Company
Tracer Test Results
Modified Slug-Dose Method
Test Date: 11/15/18
Baffling Factor (t
10
/HRT): 0.11
Average Exit Flow: 112 gpm to t
10
Average Exit Flow Range: 53 - 292 gpm
Hydraulic Residence Time (HRT): Reactor volume/flow
HRT: 497 minutes to t10t10: 55 minutesAverage Operating Volume of Tanks Filled from Top: 55,000 gallons (6.5 ft depth)Tracer Added: Fluoride (215.6 grams, over 5 minutes)Tracer Recovered at t
10: Fluoride (20.7 grams)Tracer Recovered at 4 hours: Fluoride (134.6 grams)Sample Frequency Outlet:0 – 10 min (5 min)
10 – 70 min (3 min)
70 – 240 min (5 min)
Slide4Clearwell Storage Tanks
Slide5Clearwell/Storage Tanks Inner Connected
Slide6Tracer Sample Location
Slide7North Gualala CS – Slug-Dose Curve
t
10
: 55 min
Baffling Factor = 0. 11
HRT:
497 min
Slide8North Gualala CS – Tank Exit Flow
Slide9Purpose a Tracer Study?
To determine the hydraulic efficiency or disinfectant exposure time of water through one or more reactors.
The addition of known quantities of a nonreactive chemical (tracer) is added in the form of a pulse (slug) or step-input. The time of travel or disinfectant exposure time through the reactor is related to:Flow rateReactor water volumeWater DepthReactor configuration
Slide10Disinfection Exposure Time of Fluid in Vessel for Determining Ct
10
Slide11Ct
10
Value- Log inactivation is based on the Delivered Dose, “Ct10”“C” is the disinfectant residual (mg/L)“t10” is the exposure or contact time (minutes) Multiply them:C • t10 = mg/L • min (delivered dose)
The calculated
Ct
10
value is looked up in
EPA
Ct
tables to determine the log inactivation based on specific monitoring parameters (pH, disinfectant residual and/or temperature).
Slide12Baffling Factor (BF)
Baffling factor or short-circuiting factor:
Determined from tracer study or estimatedBF = t10/ HRT from tracer studyHRT (hydraulic residence time) = reactor volume divided by reactor flowOnce the BF is determined, then it is applied to the operations of the reactor for determining the disinfectant exposure time.Example: Clearwell(s) operating volume: 55,000 gallonsExit flow: 200 gpmBF: 0.11, from tracer studyCalculated contact or disinfection exposure time: 55,000 gal ÷ 200 gpm × 0.11 = 30 minutes = t10
Slide13Test Methods
Slug-Dose or Pulse-Input MethodAdding the entire amount of tracer at the beginning of test. The reactor outlet tracer concentration is monitored for 3-4 HRT to determine mass recovery and the time (t10) it takes for 10% of the tracer mass to exit the reactor.
Modified Slug-Dose or Pulse-Input MethodIt is essentially the same as the Slug-Dose method. The different is the test is stop within 1 HRT due to the long duration to complete the test. This test can be used if the tester is confident in the amount of tracer mass added and its analytical equipment. This test was applied to North Gualala due to the HRT being over 8 hours. For full mass recovery, the test would have needed to go 3 x HRT (24 hours).
Slide14Method of Analysis and EquipmentIntellical™ ISEF121 Fluoride (F-
) Ion Selective Electrode (ISE)HQ40d Portable ISE Multi-Parameter MeterFluoride Ionic Strength Adjustor (ISA)Fluoride Standards (0.2/2.0 & 0.5/ 5.0 mg/L)50 mL graduated cylinderFinnpipette F2 variable volume pipette, capacity 0.5 - 5 mLElectrode stirrer stand50 mL beakersStir Bar, Magnetic, Polygon
Slide15Contact
Guy Schott, P.E.
State Water Resources Control Board
Division of Drinking Water
Santa Rosa, CA
Guy.Schott@waterboards.ca.gov
707-576-2732