
ETSS 15 PreImplementation Briefing College Park MD October 8 2014 Arthur Taylor Huiqing Liu and Ryan Schuster MDLNWSNOAA Purpose Should we implement ETSS 15 GFS GRIB1 files are being deprecated ID: 584516
Download Presentation The PPT/PDF document "Extra-Tropical Storm Surge" is the property of its rightful owner. Permission is granted to download and print the materials on this web site for personal, non-commercial use only, and to display it on your personal computer provided you do not modify the materials and that you retain all copyright notices contained in the materials. By downloading content from our website, you accept the terms of this agreement.


Slide1
Extra-Tropical Storm Surge(ETSS 1.5)
Pre-Implementation BriefingCollege Park, MDOctober 8, 2014Arthur Taylor, Huiqing Liu and Ryan SchusterMDL/NWS/NOAASlide2
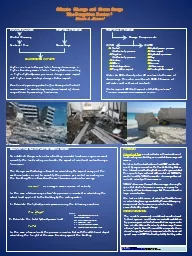
PurposeShould we implement ETSS 1.5?
GFS GRIB1 files are being deprecatedETSS 1.0 uses these for input, so we need to change before or as part of the GFS upgradeMinimal resource impactSame number of CPU for same amount of timeSlightly more memory requiredAdditional benefitsBug fixes for scripts and for the Alaska maskSlightly improved accuracy and precisionSlide3
BackgroundE
xtra-Tropical Storm Surge (ETSS)The ETSS model is a modification of the SLOSH model to use GFS winds to predict storm surgeRuns 4x dailyPredict surge to the coastline but not overland
Intended for large extra-tropical storms rather than hurricanesOutput to NDFD CONUS grid with data fromThe East Coast Basin (Updated: February 2009)The Gulf of Mexico Basin (Updated: January 2011)The West Coast Basin (Updated: February 2011)Output to NDFD Alaska grid with data fromThe Arctic Ocean Basin (Updated:
January 1996)The Bering Sea Basin (Updated: October 1998)The Gulf of Alaska Basin (Updated: April 2008)Slide4
ETSS 1.5 EnhancementsTechnical Objectives
Convert from GFS GRIB1 to GRIB2Move to vertical structure Bug fixes for error handlingScience ObjectivesCorrect mask for south Bering Sea just north of Aleutian Islands to use Bering Sea vs. Gulf of Alaska guidance
Switch input from 1 degree to 0.5 degree winds and pressureSwitch output from 5 km NDFD CONUS; 6 km NDFD Alaska to 2.5 km NDFD CONUS; 3.0 km NDFD AlaskaSlide5
ETSS 1.5 Mask Correction
Issue: Pink area on the NDFD Alaska grid came from Gulf of Alaska basin insteadof Bering Sea basin
Alaska Region and WFO’s requested itcome from the Bering Sea basinSlide6
ETSS 1.5 Mask Correction
Issue: Red circled area on the NDFD Alaska grid came from Gulf of Alaska basinAlaska Region and WFO’s requested itcome from the Bering Sea basin
http://nws.weather.gov/mdlsurge/comparison/Slide7
ETSS 1.5 OPC Science ReviewConclusions
ETSS 1.5 showed as good and at times finer detailed storm surge guidance than ETSS 1.0ETSS 1.5 compared well with NOS water level guidanceETSS is the only guidance available for the Bering Sea and ArcticSlide8
ETSS 1.5 NHC Science ReviewConclusions
Changes to the ETSS output were negligibleDifferences between ETSS 1.5 and observations were generally within a half foot (0.2 meters)Largest variance between observations and ETSS was consistently seen at the Prudhoe Bay site (MDL – ETSS 2.1 may address)
When differences between the observations and ETSS were noted, the difference seen most frequently was WL too high at low tideThere were cases where both versions of ETSS were too slow to return WL to normal after surge eventsSlide9
MDL Comparison ETSS 1.5 vs 1.0
Extra-Tropical March 2013Extra-Tropical February 2014# StationsRMSE (ETSS 1.0)
RMSE (ETSS 1.5)NY, NJ70.64 feet0.63 feetNJ, DE (bay)
50.63 feet0.62 feetMD, Chesapeake70.63 feet
0.59 feet
Outer Bank
NC
3
0.65 feet
0.63 feet
Overall
22
0.64 feet
0.62 feet
#
Stations
RMSE (ETSS
1.0)
RMSE (ETSS 1.5)
NY, NJ
7
0.59 feet
0.58 feet
NJ, D
E (bay)
5
0.66 feet
0.64
feet
MD, Chesapeake
7
0.61
feet
0.58 feet
Outer Bank
NC
3
0.69 feet
0.69 feet
Overall
22
0.63 feet
0.61 feetSlide10
MDL Comparison ETSS 1.5 vs ETSS 1.0Hurricane Irene 2011
# StationsRMSE (ETSS 1.0)RMSE (ETSS 1.5)NY, NJ70.72 feet
0.74 feetNJ, DE (bay)50.70 feet0.76 feet
MD, Chesapeake120.47 feet0.49 feetOuter Bank
NC
3
0.49 feet
0.58 feet
Overall
27
0.58 feet
0.61 feet
Peak surge comparison:
NY, NJ – Evenly split
NJ, DE (bay) – ETSS 1.5 is better than ETSS 1.0
MD, Chesapeake
–
ETSS 1.5 is better than ETSS 1.0
Outer Bank NC – ETSS 1.5 is better than ETSS 1.0Slide11
ETSS 1.5 EnhancementsScience Objectives
Correct mask for south Bering Sea just north of Aleutian Islands to use Bering Sea vs. Gulf of Alaska guidanceSwitch input from 1 degree to 0.5 degree winds and pressureOverall impact is negligibleHigher fidelity to the wind model
is for the most part beneficialMore impactful up bays and estuaries where direction and magnitude are criticalSwitch output from 5 km NDFD CONUS; 6 km NDFD Alaska to 2.5 km NDFD CONUS; 3.0 km NDFD AlaskaETSS 1.5 showed as good and at times finer detailed storm surge guidance than ETSS 1.0Slide12
Implement ETSS 1.5
OPC – Recommends implementationNHC – Recommends implementationMDL – Recommends implementationNCO?Others – Alaska Region?Others – WFOs?Slide13
FutureFY15Q3 – ETSS
2.0 “Overland East Coast, Gulf of Mexico + Post Processing”Add gridded tidal forcing where availableRe-enable overland calculationsNest coarse Extra-Tropical basins with finer Tropical basins to produce overland guidanceSHEF encode the station based Total Water Level guidance available on
MDL’s website for eventual use in AHPSFY15Q4 – ETSS 2.1 “Bering Sea and Arctic”Add gridded tidal forcingReplace Bering
Sea and Arctic basins from 1990’s with a single uniform grid with overland information to resolve Bering StraitSlide14
QuestionsSlide15
ETSS-1.5 Mask CorrectionUnalaska station
NHC – New version (right) too low with high and low tides
MDL – Station plots are derived from text as opposed to gridded product, so are not impacted by
m
ask correction
MDL – Difference here is based solely on 1 degree vs 0.5 degree wind input
ETSS
ETSS
1.5Slide16
Sample Stations ET-March 2013Slide17
Sample Stations ET-February 2014Slide18
Sample Stations Hurricane Irene 2011