
on Professionals in the Disability Community Jacqueline D Stone PhD Baltimore MD United States MD Kennedy Krieger Institute UCEDDLEND Waylon J Howard PhD Baltimore MD United States MD Kennedy Krieger Institute UCEDDLEND ID: 739619
Download Presentation The PPT/PDF document "The Fit of the Interaction with Disabled..." is the property of its rightful owner. Permission is granted to download and print the materials on this web site for personal, non-commercial use only, and to display it on your personal computer provided you do not modify the materials and that you retain all copyright notices contained in the materials. By downloading content from our website, you accept the terms of this agreement.


Slide1
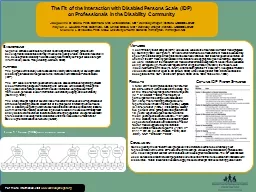
The Fit of the Interaction with Disabled Persons Scale (IDP)
on
Professionals in the Disability Community
Jacqueline D. Stone, PhD, Baltimore, MD, United States, MD - Kennedy Krieger Institute, UCEDD/LEND;
Waylon J. Howard, PhD, Baltimore, MD, United States, MD - Kennedy Krieger Institute, UCEDD/LEND;
Michelle L.
D'Abundo, PhD, MSH, University of North Carolina Wilmington, Wilmington, NC
Figure 1 : Gething (1994) proposed factor structure
For more information, visit
www.kennedykrieger.org
A confirmatory factor analysis (CFA) was used to evaluate the theoretical six-factor model proposed by Gething (1994; see Figure 1). CFAs are often referred to as measurement models because they specify the relationships among latent and observed variables. Our research question centered on whether the IDP model hypothesized in the literature was appropriate given our sample. Specifically, we were interested if the measurement model demonstrated acceptable fit. Model fit was evaluated using chi-square (χ2), Root-Mean-Square Error of Approximation (RMSEA), the Tucker Lewis Index/Non-Normed Fit Index (TLI/NNFI), and the Comparative Fit Index (CFI). Acceptable RMSEA values are less than or equal to .08 (Brown, 2006) while values greater than .90 are considered acceptable for the NNFI, and the CFI (Brown, 2006; Kline, 1993; Reise, et al., 1993).
Methods
The purpose of this study was to assess the validity and reliability of developmental disability professionals' responses to the Interaction with Disabled Persons Scale (IDP). The IDP scale is a 19-item questionnaire used to assess attitudes regarding personal discomfort at the prospect of interacting with someone with a disability through the application of six factors (discomfort in social interaction, coping/succumbing framework, perceived level of information, vulnerability, coping, and vulnerability (Gething, 1994).The study brought together several lines of research that focus on self-report scales of attitudes regarding personal discomfort at the prospect of interacting with someone with a disability, exploring whether observed attitudinal variables (indicators) related to common themes (factors) described in previous research. We used confirmatory factor analysis to test a theoretical factor structure among a population of experienced health professionals in developmental disabilities within the Association of Canters for Developmental Disabilities Network (AUCD).
purpose
Negative attitudes contribute to greater health disparities among persons with developmental disabilities and may influence the quality of care. Attitudinal research in the developmental disability field has used predominantly self-report scales to report information (Iacono, Tracy, Keating, & Brown, 2009).
Background
Results
A total of 211 health professionals (13.70% men; 86.30% women) were included in the study. Age at the time of survey ranged from 26 to 79 years (M = 61.36, SD = 10.83). The majority of participants in the sample were Caucasian (87.40%). The remaining participants were reported to be African American (5.40%), Hispanic (5.40%) or other (1.20%). In this sample, seventy-two percent of the participants had greater than 10 years' experience post licensure, and the mean years post licensure was 20 +/- 1.01 years in the disability field, interpreted as having greater exposure to individuals with disabilities. The six-factor model suggested by the literature demonstrated mediocre to poor fit, χ2 (107, n = 211) = 247.87, p <.001, RMSEA = .079 (.066-.092), NNFI = 0.755, CFI = 0.807.
Conclusion
Consequently, the six-factor model proposed in the literature seems to be a relatively poor representation of the of the IDP scale among this sample of developmental disability professionals who have had greater contact with individuals with developmental disabilities
.
The IDP scale has been used across allied health student populations who have had minimal to no contact with individuals with disabilities. Future research is needed to apply the scale amongst trainees entering public health.
Gething IDP Factor Structure