
James D Fleck MD Medical Director IU Health Methodist Hospital Comprehensive Stroke Center Disclosures None Stroke Statistics Heart Disease and Stroke Statistics 2014 795000 new or recurrent strokesyear ID: 509404
Download Presentation The PPT/PDF document "The Future of Stroke" is the property of its rightful owner. Permission is granted to download and print the materials on this web site for personal, non-commercial use only, and to display it on your personal computer provided you do not modify the materials and that you retain all copyright notices contained in the materials. By downloading content from our website, you accept the terms of this agreement.


Slide1
The Future of Stroke
James D. Fleck, M.D.
Medical Director
IU Health Methodist Hospital
Comprehensive Stroke CenterSlide2
Disclosures
NoneSlide3
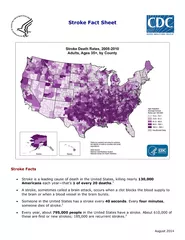
Stroke StatisticsHeart Disease and Stroke Statistics 2014
~795,000 new or recurrent strokes/year
87% Ischemic, 10% ICH, 3% SAH
1 stroke every 40 seconds in US
1 death from stroke every 4 minutes in US
4
Th
leading cause of death in US
Decline in stroke mortalitySlide4
US age-standardized death rates* attributable to CVD, 2000 to 2010.
Alan S. Go et al. Circulation. 2014;129:e28-e292
Copyright © American Heart Association, Inc. All rights reserved.Slide5
Prevalence of stroke by age and sex (National Health and Nutrition Examination Survey: 2007–2010).
Alan S. Go et al. Circulation. 2014;129:e28-e292
Copyright © American Heart Association, Inc. All rights reserved.Slide6
Annual rate of first cerebral infarction by age, sex, and race (Greater Cincinnati/Northern Kentucky Stroke Study: 1999).
Alan S. Go et al. Circulation. 2014;129:e28-e292
Copyright © American Heart Association, Inc. All rights reserved.Slide7
Annual age-adjusted incidence of first-ever stroke by race.
Alan S. Go et al. Circulation. 2014;129:e28-e292
Copyright © American Heart Association, Inc. All rights reserved.Slide8
The 22 leading diagnoses for direct health expenditures, United States, 2010 (in billions of dollars).
Alan S. Go et al. Circulation. 2014;129:e28-e292
Copyright © American Heart Association, Inc. All rights reserved.Slide9
Projected total costs of cardiovascular disease (CVD), 2015 to 2030 (2012 $ in billions) in the United States.
Alan S. Go et al. Circulation. 2014;129:e28-e292
Copyright © American Heart Association, Inc. All rights reserved.Slide10
Treatment of Acute Ischemic Stroke
Neuroprotection
ReperfusionSlide11
Time Is Brain !!
Neurons Lost
Synapses Lost
Accelerated Aging
Per Stroke
1.2 billion
8.3 trillion
36 yrs
Per Minute
1.9 million
14 billion
3.1 wks
Per Hour
120 million
830 billion
3.6 yrsSlide12
Modified Rankin Score
0 = No symptoms at all
1 = No significant disability despite symptoms: able to carry out all usual duties and activities
2 = Slight disability: unable to carry out all previous activities but able to look after own affairs without assistance
3 = Moderate disability: requiring some help, but able to walk without assistance
4 = Moderately severe disability: unable to walk without assistance and unable to attend to own bodily needs without assistance
5 = Severe disability: bedridden, incontinent, and requiring constant nursing care and attention6 = Patient deathSlide13
Endovascular Ischemic Stroke Treatment
MR CLEAN -
NEJM 2015; 372: 11-
20
Multicenter Randomized
CLinical
trial of Endovascular treatment for Acute ischemic stroke in NetherlandsESCAPE – NEJM 2015; 372: 1019-30Endovascular treatment for Small Core and Anterior circulation Proximal occlusion with Emphasis minimizing ct to recanalization timesEXTEND- IA – NEJM 2015; 372: 1009-18EXtending the time for Thrombolysis in Emergency Neurologic DeficitsSWIFT – PRIMESolitaire FR With the Intention For Thrombectomy as PRIMary Endovascular treatment for acute ischemic strokeSlide14
Endovascular Ischemic Stroke Treatment
MR CLEAN – Netherlands
Age
>
18
yrs
ESCAPE – Canada / US / othersAge > 18 yrsEXTEND IA – Australia / New ZealandAge > 18 yrsSWIFT PRIME – US / EuropeAge 18-80 yrsSlide15
Endovascular Ischemic Stroke Treatment
#
Patients
Mean
Age
OcclusionTime WindowNIHSSMR CLEANIA – 233Control 26765yDistal ICA or MCA or ACAIA < 6 hr< 2Mean:IA 17 Control 18ESCAPEIA – 165Control15070-71yDistal ICA or MCA12 hr from onset (15.5% > 6 hr)None at entryMean:IA 16Control 17EXTEND IAIV – 35IV/IA - 35IV- 70 yIV/IA – 69y
ICA or MCA (1st or 2nd segment)IV < 4.5 hrIA start < 6 hr finish
< 8 hrNone at entryMean:IV 13IV/IA 17SWIFT PRIMEIV – 98IV/IA - 98IV – 66y
IV/IA – 65yDistal ICA or prox MCAIA < 6 hr groin puncture8-29Mean:IV 17IV/IA 17Slide16
Endovascular Ischemic Stroke Treatment
Radiology
Inclusion
ASPECTS
% patients
receiving iv
tpaMedian time stroke onset to iv tpaMR CLEANCTA/MRA Shows occlusionNo inclusion #Median 9IA 87.1%Control 90.6%85-87 minESCAPENCCTASPECTS 6-10CTAMod-good collateralsMedian 9IA 72.7%Control 78.7%IA 110 minControl 125 minEXTEND IANCCTCTACTP100 %IV 145 minIV/IA 127 minSWIFTPRIMECTA/MRA Shows occlusion< 6 was exclusion100%IV 117 minIV/IA 110 minSlide17
CT Angiography and PerfusionSlide18
CT PerfusionSlide19
ASPECTSSlide20
Endovascular Ischemic Stroke Treatment
IA treatment
retrievable
stent
IA with GA
Median stroke onset
to groinMedian stroke onset to reperfusionMR CLEANAny type mechanical thrombectomy(Rare thrombolytic agent)81.5%37.8%260 minESCAPERetrievable stent recommended (not mandated)86.1%9.1%185 min218 minEXTEND IASolitaire100%36%210 min253 minSWIFT PRIMESolitaire100%Stroke onset to first deployment 252 minSlide21
Endovascular Ischemic Stroke Treatment
90 day MRS 0-2
TICI
2b/3
MR CLEAN
IA – 32.6%
Control – 19.%OR 2.16 (1.39-3.38)“Absence residual occlusion”IA – 75.4%Control – 38.9%ESCAPEIA – 53%Control – 29.3%OR 1.7 (1.3-2.2)IA – 72.4%EXTEND IAIV -40%IV/IA – 71%P = 0.01IA -86%SWIFT PRIMEIV – 35.5%IV/IA – 60.2%OR 2.75(1.5-4.95)IA – 88%Slide22
Endovascular Ischemic Stroke Treatment
Symptomatic
ICH
Mortality
MR CLEAN
IA – 7.7%
Control – 6.4%30 dayIA – 18.9%Control – 18.4%ESCAPEIA – 3.6%Control- 2.7%IA – 10.4 %Control- 19%EXTEND IAIV- 6%IV/IA – 0%IV – 20%IV/IA – 9%SWIFT PRIMEIV- 3.1%IV/IA – 1.0%IV – 12.4%IV/IA – 9.2%Slide23
Endovascular Ischemic Stroke Treatment
Do you have Interventional MDs and teams?
At your hospital?
At another hospital?
Available 24/7/365?
How do you access Interventional teams?
What advanced imaging is available?Which patients receive advanced imaging?When do patients receive advanced imaging?Slide24
Mobile Stroke Units
Berlin, Germany
Univ
Texas-Houston Medical School – Houston, TX
Cleveland ClinicSlide25
Mobile Stroke UnitsSlide26
Mobile Stroke UnitsSlide27
Mobile Stroke Units
PHANTOM –S
Prehospital Acute Neurological Treatment and Optimization of Medical Care in Stroke Study
Berlin Germany
STEMO – Stroke Emergency Mobile
JAMA 2014; 311: 1622-1631Slide28
PHANTOM-S
Mean alarm-to-treatment time
51.8 min
76.3 min control/usual time
No increased risk for intracerebral hemorrhage or deathSlide29
Mobile Stroke Units
Ambulance with CT scanner
Ambulance personnel
EMS organization
Point-of-care labs
Telemedicine connection
CostSlide30
Future of Stroke Care
Organization
PSC and CSC
State laws requiring where patients receive care
Neuroprotection
EMS deployment of meds
Enhancing recovery and rehabilitationSlide31
Questions?