
Johnson DJ Ostlund EN Pedersen DD Schmitt BJ Detection of North American West Nile Virus in Animal Tissue by a Reverse TranscriptionNested Polymerase Chain Reaction Assay Emerg Infect Dis 200174739741 httpsdoiorg103201eid0704017425 ID: 1026956
Download Presentation The PPT/PDF document "Figure 2 Figure 2. . Visual comparison o..." is the property of its rightful owner. Permission is granted to download and print the materials on this web site for personal, non-commercial use only, and to display it on your personal computer provided you do not modify the materials and that you retain all copyright notices contained in the materials. By downloading content from our website, you accept the terms of this agreement.


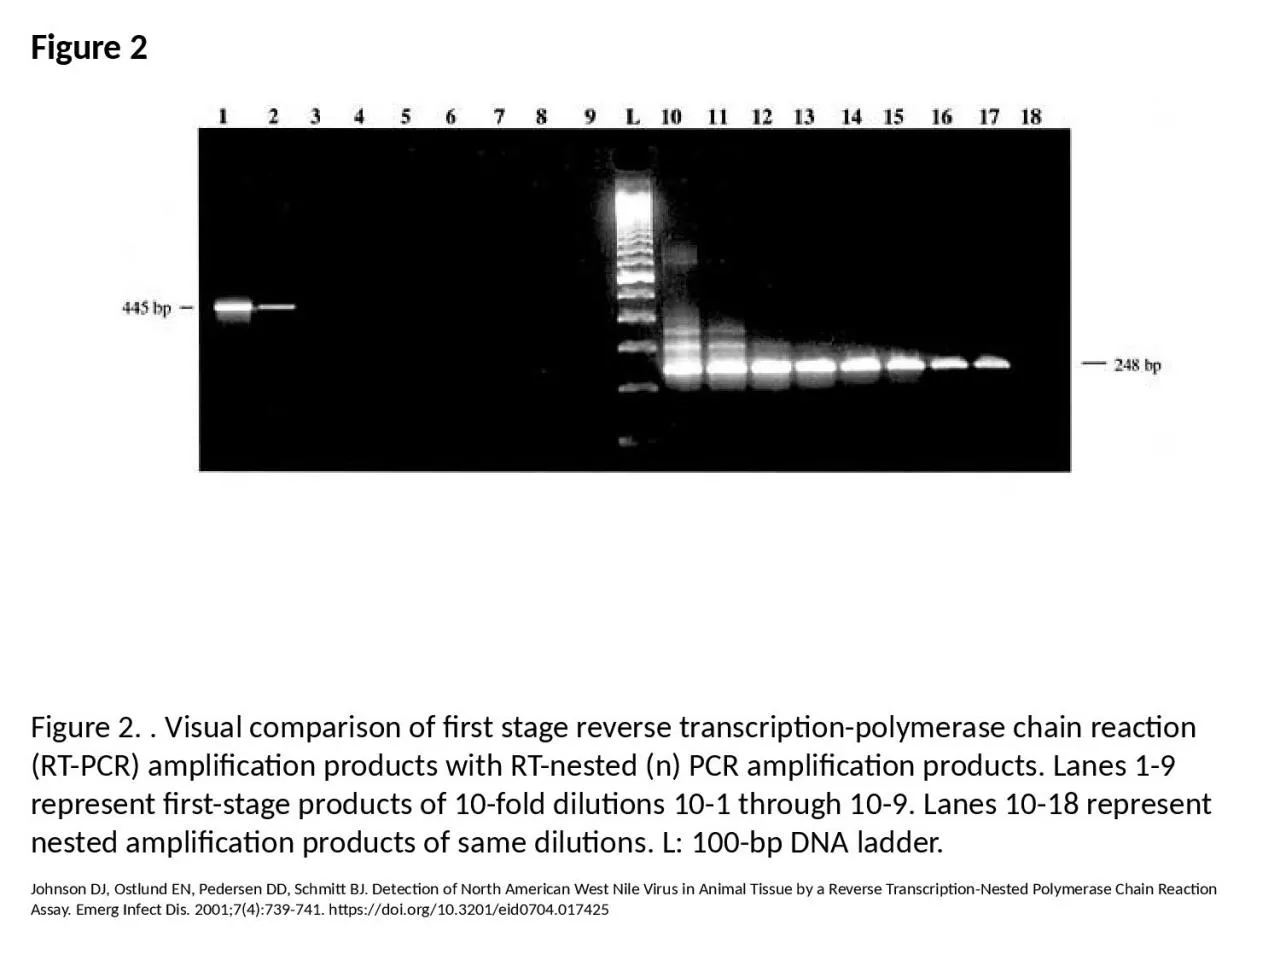
1. Figure 2Figure 2. . Visual comparison of first stage reverse transcription-polymerase chain reaction (RT-PCR) amplification products with RT-nested (n) PCR amplification products. Lanes 1-9 represent first-stage products of 10-fold dilutions 10-1 through 10-9. Lanes 10-18 represent nested amplification products of same dilutions. L: 100-bp DNA ladder.Johnson DJ, Ostlund EN, Pedersen DD, Schmitt BJ. Detection of North American West Nile Virus in Animal Tissue by a Reverse Transcription-Nested Polymerase Chain Reaction Assay. Emerg Infect Dis. 2001;7(4):739-741. https://doi.org/10.3201/eid0704.017425