
Perdigão experimental science goals Julie K Lundquist Prof University of Colorado at Boulder amp Scientist National Wind Technology Center NREL 1 Multiscale flow interactions Whenhow are the flow structures in the valley impacted by local thermal circulation for a given incid ID: 514759
Download Presentation The PPT/PDF document "Headline" is the property of its rightful owner. Permission is granted to download and print the materials on this web site for personal, non-commercial use only, and to display it on your personal computer provided you do not modify the materials and that you retain all copyright notices contained in the materials. By downloading content from our website, you accept the terms of this agreement.


Slide1
Headline
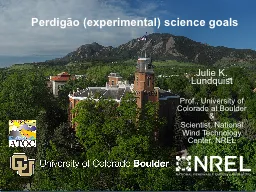
Perdigão
(experimental) science goals
Julie K. LundquistProf., University of Colorado at Boulder &Scientist, National Wind Technology Center, NRELSlide2
1. Multiscale flow interactions
When/how are the flow structures in the valley impacted by local thermal circulation for a given incident flow? How do the slope and valley flows interact? Multiscale flow interactions
.characterize mesoscale (including ocean/SST as site is 100km from the coast) required for mesoscale/microscale couplingcharacterize inflow
pressure measurements for waves and characterizing unsteady flowsdifferential heatingSlide3
2. Influence of terrain heterogeneityWhat is the impact of “The Gap” on the flow field?
flow channelingvariations with stabilityThe 3D nature of the ridges may also influence channeling and recirculation – how?Slide4
3. Transitions & Diurnal CycleWhat determines the location and character of features such as fronts during transitions?
What are the impacts of various forcing mechanisms on TKE and the TKE balance through the diurnal cycle?continuous high-rate measurements of winds, pressureprofiles and transects to estimate advection and turbulence transport terms
UAVs and tethered lifting systems could helpmixed layer depthSlide5
4. HeterogeneityWhat is the impact of
microscale heterogeneity?roughness, moisture, soil moisture, sap flow, vegetative canopy, differential heatingremember sonic footprint issuesneed lidar measurements, aerial photographs, right before campaign to characterize elevation and vegetative canopy
What data do we need to collect to reassess/surpass MOST?Assess spatial coherence; need to cross-calibrate instrumentsSlide6
5. Turbine interactionsHow does the turbine wake generate and interact with coherent structures induced by terrain flow?
Wake meander in the horizontal and verticalTKE budgets in wakeDoes the wake affect flow in the valley?Slide7
6. BudgetsWhat is the complete hydrological balance of the valley?Perhaps CO2 as well, but be careful and consult with a CO2 personSlide8
7. Instrumentation science questions (Broader Impacts!)How to define optimal lidar scanning strategies?
will build on results from Windscanner (3 Windcube 200S operated synchronously) deployment in 2015How to use
sonics, radiometers in complex and heterogeneous terrain?Slide9Slide10
Possible strategies for science proposals (to help ensure that everyone gets funded)
Map each important question from SPO to an investigator to ensure everyone gets funded?Collaborative proposals between investigators can link complementary investigationsmany of us bring both modeling and obs expertise: be careful with areas of overlap to ensure they are complementary
Do we all submit to NSF AGS/PDM? Should we also look into NSF Fluid Dynamics? (Energy for Sustainability not currently funding wind-related work)European focus is on improving wind resource assessment models (wind application). US participation can focus on advancing state of science to improve the model chain and process studies.Interaction between SPO and MRI – be sure to define a plan with/out CentNet
. Specify the science that can be done with/out CentNet.Make the clear case that we are leveraging significant European resources to justify the additional expense of transporting US participants to EuropeSlide11Slide12Slide13Slide14
CU-Boulder goals for Perdigão: observations and simulations
documenting and understanding the diurnal cycles of wind, turbulence, turbulence dissipation rate, and atmospheric stability at the Perdigão
double-hill site assessing how this daily cycle affects the evolution of wind speed and turbulence at turbine altitudes and the resulting evolution of wind turbine loads and wind turbine wakes in complex
terrainSlide15
CU’s Remote sensing platforms2-3
Windcube v1 profiling lidars (winds and lidar turbulence 40m-220mabove surface, dz
=20m )Microwave radiometer (T, RH, precip) 0-10km
CU and NCAR lidar deployments at the CWEX-13 experiment, Iowa
CU and ISU staff with radiometer at
CWEX-13 experiment, IowaSlide16
In situ observations (require coordination with Portugese Air Force)
Tethered lifting system
UAV (1-m wingspan Datahawk)
21’ Test Blimp
Turbulence
Payload
Winch
Wind
Vane
Turbulence
Payload
Used to quantify winds, temp, and
TKE dissipation rate in wind turbine wakes
(Lundquist &
Bariteau
2014,
BLM
, to appear)
Lawrence and
Balsley
2013,
J TechSlide17
In flat terrain, lidars are suitable to provide “inflow” conditions, but “corrections” (based on CFD) are usually applied to complex terrain
Corrections are product-specificUsually based on neutral BL flow
Vogstad
et al. 2013Slide18
Inhomogeneous flow challenges the assumptions of the lidar, introducing error that can be quantified with stability-aware modeling (wake example)
Using CFD, we simulate stable BL flow past
a wind turbine (actuator line mode).
Lundquist, Churchfield, Lee, and Clifton, 2014, AMTD
We introduce hypothetical
lidars
into the flow
and calculate the difference between what
the lidar actually saw and what it should have seen.Slide19
Largest errors are within 1D, but even at 3D downstream, cross-stream velocities are unreliable
Lundquist, Churchfield, Lee, and Clifton, 2014,
AMTD
3D Downstream – 10 minute average .y/D=-0.8y/D=0y/D=+0.8
y/D=-0.8
y/D=0
y/D=+0.8
-1 -0.5 0 0.5 1
U error (m/s)
-1 -0.5 0 0.5 1
V error (m/s)
200
150
100
50
200
150
100
50
height (m)Slide20
Assessing stability with radiometer (CWEX-13)Slide21
TKE dissipation from TLS compares well to towers outside turbine wake
Lundquist and
Bariteau, 2014, BLM
to appearSlide22
TLS shows enhanced dissipation in wake – in neutral conditions
Lundquist and
Bariteau, 2014, BLM to appearSlide23
For Perdigão, we can test the hypothesis that stability drives variability in dissipation rate, even within the wake
Lidars quantify inflowRadiometer helps quantify stability
TLS and UAV document dissipation rate…And then challenge LES with these observationsSlide24
How skillful are models at capturing this cycle of stability and its interaction with wind turbine wakes?WRF-LES for CBL
WRF-LES for SBL
Aitken, Kosovic, Mirocha, and Lundquist 2014 JRSE
Mirocha, Lundquist et al. 2014 JRSE
Flow