

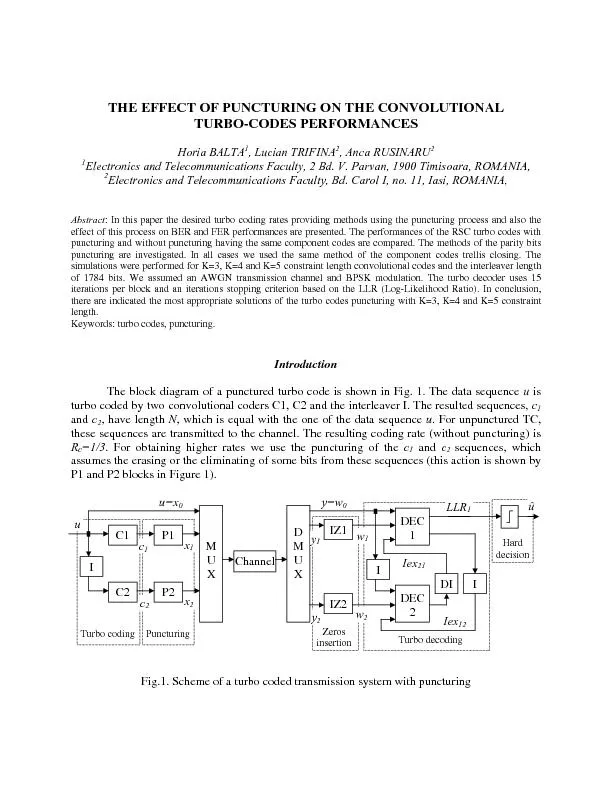
Relational Schema Database Normalization Analysis Queries QampA Introduction Client Overview Our goal is to help your child feel good about himselfherself so they can have the confidence it takes to get along well with others ID: 724943
Download Presentation The PPT/PDF document "Introduction EER Diagram" is the property of its rightful owner. Permission is granted to download and print the materials on this web site for personal, non-commercial use only, and to display it on your personal computer provided you do not modify the materials and that you retain all copyright notices contained in the materials. By downloading content from our website, you accept the terms of this agreement.


Slide1Slide2
Introduction
EER Diagram
Relational Schema
Database
Normalization Analysis
Queries
Q&ASlide3
Introduction | Client Overview
“Our goal is to help your child feel good about himself/herself so they can have the confidence it takes to get along well with others.”
Growing Light Montessori Schools serves children ages 2-12 in a variety of different classesThey have campuses in Oakland, Kensington, and Moraga
Currently, Growing Light is using Excel to organize their data
This is leading to problems of many forms in different places and overall clutter
Growing Light would like to move to Microsoft Access
A
llows all storage of data in one place, and allows new and better ways to organize informationSlide4
Introduction
EER Diagram
Relational Schema
Database
Normalization Analysis
Queries
Q&ASlide5
Simplified EER DiagramSlide6
Introduction
EER Diagram
Relational Schema
Database
Normalization Analysis
Queries
Q&ASlide7
Relational Schema
Student(
SID, Student_SSN, Fname, Lname, MI, DOB, Gender, street, city, state, zip, start_date,
house_phone, contract_amount, (Adtype)14)
14. Ad_medium(AdType, cost, duration, starting_month)Slide8
Relational SchemaSlide9
Introduction
EER Diagram
Relational Schema
Database
Normalization Analysis
Queries
Q&ASlide10
Database Form 1
Form allows client to input new employee informationSlide11
Database Form 2
Form allows client to input new student informationSlide12
Introduction
EER Diagram
Relational Schema
Database
Normalization Analysis
Queries
Q&ASlide13
Normalization AnalysisSlide14
Normalization AnalysisSlide15
Normalization AnalysisSlide16
Introduction
EER Diagram
Relational Schema
Database
Normalization Analysis
Queries
Q&ASlide17
Query 1: Equipment Order Management
Order cycle in days
= (EOQ/Demand)*360Next Order Date = Last Purchase Date + Order Cycle ( In case of stock out, current date becomes the next order date ) Slide18
Query 1: Equipment Order Management Slide19
SELECT EID, Equip_Name, IIF(Inventory=0, 'Yes', 'No') AS
Stockout, round(sqr(2*[FixedCost]*[Demand]/([InterestRate]/100*[
UnitCost]))) AS EOQ, round(((sqr(2*[FixedCost]*[Demand]/([
InterestRate]/100*[UnitCost])))/[Demand])*360) AS OrderCycle, IIF([Inventory]=0, Date(), ([PurchaseDate
]+round(((sqr(2*[FixedCost]*[Demand]/([InterestRate]/100*[UnitCost])))/[Demand])*360))) AS
NextOrderDateFROM Equipment_Supply_Token
ORDER BY IIF([Inventory]=0, Date(), ([
PurchaseDate
]+round(((
sqr
(2*[
FixedCost
]*[Demand]/([
InterestRate
]/100*[
UnitCost
])))/[Demand])*360))) ASC;
Equipment Order Management : SQLSlide20
MS Access ImplementationSlide21
Equipment Order Management : Report
Shows next order date & EOQ predicted quantitiesSlide22
Query 2: Student Performance Prediction
Absolute change
in grade with respect to time
Percentage change
in grade with respect to timeSlide23
Query 2: Student Performance Prediction Slide24
Student Performance : SQL
SELECT [Performance Report Query].SID, (Avg([Month_date]*[AvgOfGrade])-(Avg([Month_date])*
Avg([AvgOfGrade])))/(Avg(([Month_date])^2)-(Avg([Month_date
]))^2) AS Linearchange, Avg([AvgOfGrade])-[Linearchange]*Avg
([Month_date]) AS Linearalpha, [Linearchange]*([max_month]+1)+(Avg([
AvgOfGrade])-[Linearchange]*Avg([Month_date])) AS LinearPredictionNextMonth, (
Avg
([
LogMonth_date
]*[
AvgOfGrade
])-(
Avg
([
LogMonth_date
])*
Avg
([
AvgOfGrade
])))/(
Avg
(([
LogMonth_date
])^2)-(
Avg
([
LogMonth_date
]))^2) AS
Logcoeff
,
Avg
([
AvgOfGrade
])-([
Logcoeff
])*
Avg
([
LogMonth_date
]) AS
Logalpha
, ([
Logcoeff
]*4+(
Avg
([
AvgOfGrade
])-[
Logcoeff
]*
Avg
([
LogMonth_date
])))/100 AS
LogPercentageChange
, [
LinearPrediction
]*Exp([
LogPercentageChange
]) AS
LogPredictionNextMonth
, Max([Performance Report Query].
Month_date
) AS
max_month
, [
Linearchange
]*([
max_month
])+(
Avg
([
AvgOfGrade
])-[
Linearchange
]*
Avg
([
Month_date
])) AS
LinearPrediction
FROM [Performance Report Query]
GROUP BY [Performance Report Query].SID;Slide25
Student Performance : SQL
SELECT [Performance Report Query].SID, (Avg([Month_date]*[AvgOfGrade])-(Avg([Month_date])*
Avg([AvgOfGrade])))/(Avg(([Month_date])^2)-(Avg([Month_date
]))^2) AS Linearchange, Avg([AvgOfGrade])-[Linearchange]*Avg
([Month_date]) AS Linearalpha, [Linearchange]*([max_month]+1)+(Avg([
AvgOfGrade])-[Linearchange]*Avg([Month_date])) AS LinearPredictionNextMonth, (
Avg
([
LogMonth_date
]*[
AvgOfGrade
])-(
Avg
([
LogMonth_date
])*
Avg
([
AvgOfGrade
])))/(
Avg
(([
LogMonth_date
])^2)-(
Avg
([
LogMonth_date
]))^2) AS
Logcoeff
,
Avg
([
AvgOfGrade
])-([
Logcoeff
])*
Avg
([
LogMonth_date
]) AS
Logalpha
, ([
Logcoeff
]*4+(
Avg
([
AvgOfGrade
])-[
Logcoeff
]*
Avg
([
LogMonth_date
])))/100 AS
LogPercentageChange
, [
LinearPrediction
]*Exp([
LogPercentageChange
]) AS
LogPredictionNextMonth
, Max([Performance Report Query].
Month_date
) AS
max_month
, [
Linearchange
]*([
max_month
])+(
Avg
([
AvgOfGrade
])-[
Linearchange
]*
Avg
([
Month_date
])) AS
LinearPrediction
FROM [Performance Report Query]
GROUP BY [Performance Report Query].SID;Slide26
Student Performance : Execution
Prediction based on
percentage change
Prediction based on
absolute changeSlide27
Student Performance : Report
Shows student’s current grade and predicted grade for next semester Slide28
Query 3: Student BalanceSlide29
Query 3: Student Balance
Contract-Val is the total charges for the student over the time period indicated under Contract_Start and Contract_End.
Tables Used
...
1
2Slide30
Student Balance : SQL
SELECT Student.SID, First(DateDiff("m",[Student].[Contract_Start],date())) AS DurationFROM Student ;
SELECT Student.SID, [Student].[Contract_Val]/DateDiff("m",[Student].[
Contract_Start],[Student].[Contract_End]))AS Monthly_FeeFROM Student;
SELECT S_Monthly_Fee.SID, [S_Monthly_Fee].[Monthly_Fee]*[Contract_Duration
].[Duration] AS TotalChargedFROM S_Monthly_Fee, Contract_DurationWHERE (((S_Monthly_Fee.SID)=[
Contract_Duration
].[SID]));
SELECT Student.SID, Sum(([
Student_Account
].[
MP_Amount
])) AS
TotalPaid
FROM
Student_Account
, Student
WHERE Student.SID=Student_Account.SID
GROUP BY Student.SID;
SELECT
Student.Fname
,
Student.Lname
, [
S_TotalCharged
].[
TotalCharged
]-[
S_TotalPaid
].[
TotalPaid
] AS Balance,
IIf
(
S_TotalCharged.TotalCharged-S_TotalPaid.TotalPaid
>0,(
S_TotalCharged.TotalCharged-S_TotalPaid.TotalPaid
)*0.1,0) AS
PenaltyFee
FROM Student,
S_TotalCharged
,
S_TotalPaid
WHERE Student.SID=S_TotalCharged.SID And Student.SID=S_TotalPaid.SID And S_TotalPaid.SID=S_TotalCharged.SID;
Contract_Duration
S_Monthly_Fee
S_TotalCharged
S_TotalPaid
Student_BalanceSlide31
Student Balance : ImplementationSlide32
Student Balance : ImplementationSlide33
Query 4: Ad Medium ROI
Calculated monthlySlide34
Query 4: Ad Medium ROISlide35
Ad Medium ROI : SQL
SELECT Ad_medium.Adtype, Ad_medium.monthyear, (Sum([Contract_amt]/[Contract_dur]))/(([cost]*[quantity]))-1 AS ROI
FROM Ad_medium INNER JOIN Student ON (Ad_medium.Adtype = Student.Referred_by) AND (Ad_medium.monthyear = Student.Referred_mon)
GROUP BY Ad_medium.Adtype, Ad_medium.monthyear, ([Cost]*[quantity])
ORDER BY (Sum([Contract_amt]/[Contract_dur]))/(([cost]*[quantity]))-1 DESC;Slide36
Ad Medium ROI : SQLSlide37
Query 5: Classroom Scheduling
Put 1 class in each timeslotSlide38
Query 5: Classroom SchedulingSlide39
Methodology
Query 5: Classroom SchedulingSlide40
Query 5: Matlab
Main code:clear;clear allclc M=30;%number of CHROMOSOMES (not pairs, pairs=2*!) generated every generation
N=70; %number of generations to runnogen=500;classes=[ 1 31 12 0 2 30
2 31 14 0 2 253 56 12 0 1 304 54 12 0 1 305 72 14 0 0 256 54 14 0 0 257 56 14 0 0 258 56 12 0 0 30];
[noclasses,classproperties]=size(classes); % initialize blank schedule matrixschedule=[];
%initialize matrix of chromosomes %generate first parentset (random)for i=1:N+Mchromosomemat
(
i
,:)=
randperm
(
noclasses
);
fitnessvalue
(
i
)=
fitval
(
chromosomemat
(
i
,:));
end
for t=1:nogen
%get rid of N chromosomes with the smallest N values
%find
indice
of smallest value in fitness value and kill from
%
chromosomemat
for
i
=1:N
[~,I]=min(
fitnessvalue
);
chromosomemat
(I,:)=[];
fitnessvalue
(I)=[];
end
for
i
=1:N
chromosomemat
(
M+i
,:)=
randperm
(
noclasses
);
fitnessvalue
(
M+i
)=
fitval
(
chromosomemat
(
M+i
));
end
end
[~,
maxchromo
]=max(
fitnessvalue
);
max_chromosome
=
chromosomemat
(
maxchromo
,:)
maxfitness_value
=
fitval
(
max_chromosome
)
FitVal
function:
function [
fitnessvalue
, counter]=
fitval
(chromosome)
%timetable=[
%'Mo' 9 'room1' 0 1 40
%'Mo' 10 'room1' 0 1 40
%'
Tu
' 9 'room1' 0 1 40
%'
Tu
' 10 'room1' 0 1 40
%'Mo' 9 'room2' 0 2 30
%'Mo' 10 'room2' 0 2 30
%'
Tu
' 9 'room2' 0 2 30
%'
Tu
' 10 'room2' 0 2 30];
timeslot=[
1 9 1 0 1 40
1 10 1 0 1 40
2 9 1 0 1 40
2 10 1 0 1 40
1 9 2 0 2 30
1 10 2 0 2 30
2 9 2 0 2 30
2 10 2 0 2 30];
%
Classtable
=[
%'Music1A' 'Boleyn' 'Hummingbirds' 0 1 30
%'Math1A' 'Thurman' 'Hummingbirds' 0 1 30
%'Gym' 'Lee' %'
Froggies
' 0 2 30
%'Gym' 'Lee' '
Froggies
' 0 2 25
%'Reading2' 'Johnson' '
Froggies
' 0 0 25
%'Math1B' 'Thurman' %'Hummingbirds' 0 0 25
%'Nap' 'Boleyn' '
Froggies
' 0 0 25
%'Reading1' 'Boleyn' 'Hummingbirds' 0 0 30];
%rearranging such that those with no equipment constraints go last
classes=[
1 31 12 0 2 30
2 31 14 0 2 25
3 56 12 0 1 30
4 54 12 0 1 30
5 72 14 0 0 25
6 54 14 0 0 25
7 56 14 0 0 25
8 56 12 0 0 30];
[~,
classproperties
]=size(classes);
height=length(chromosome);
for
i
=1:height
chromosomerep
(
i
,:)=classes(chromosome(
i
),:);
end
counter=0;
[
notimeslot,timeproperties
]=size(timeslot);
for
i
=1:height
if
chromosomerep
(i,5)==timeslot(i,5) ||
chromosomerep
(i,5)==0
counter=counter+1;
else
counter=counter-100;
end %match the capacity
if
chromosomerep
(i,4)==timeslot(i,4);
counter=counter+1;
elseif
chromosomerep
(i,4)==0;
counter=counter+1;
else %match the equipment
counter=counter-100;
end
for j=1:height
if j==
i
else
if
chromosomerep
(i,2)==
chromosomerep
(j,2) && timeslot(i,1)==timeslot(j,1)&& timeslot(i,2)==timeslot(j,2)
%same teacher & same day &same time
counter=counter-100;
end
%make sure the teachers will not have clashing schedules
if
chromosomerep
(i,3)==
chromosomerep
(j,3) && timeslot(i,1)==timeslot(j,1) && timeslot(i,2)==timeslot(j,2)
%same teacher & same day &same time
counter=counter-100;
end
end
end
end
fitnessvalue
=counter;
end
Slide41
Query 5: ExecutionSlide42
Further Work
Segmentation of students for better management of their performance
Using similarities between students to group them together
Cluster AnalysisSlide43