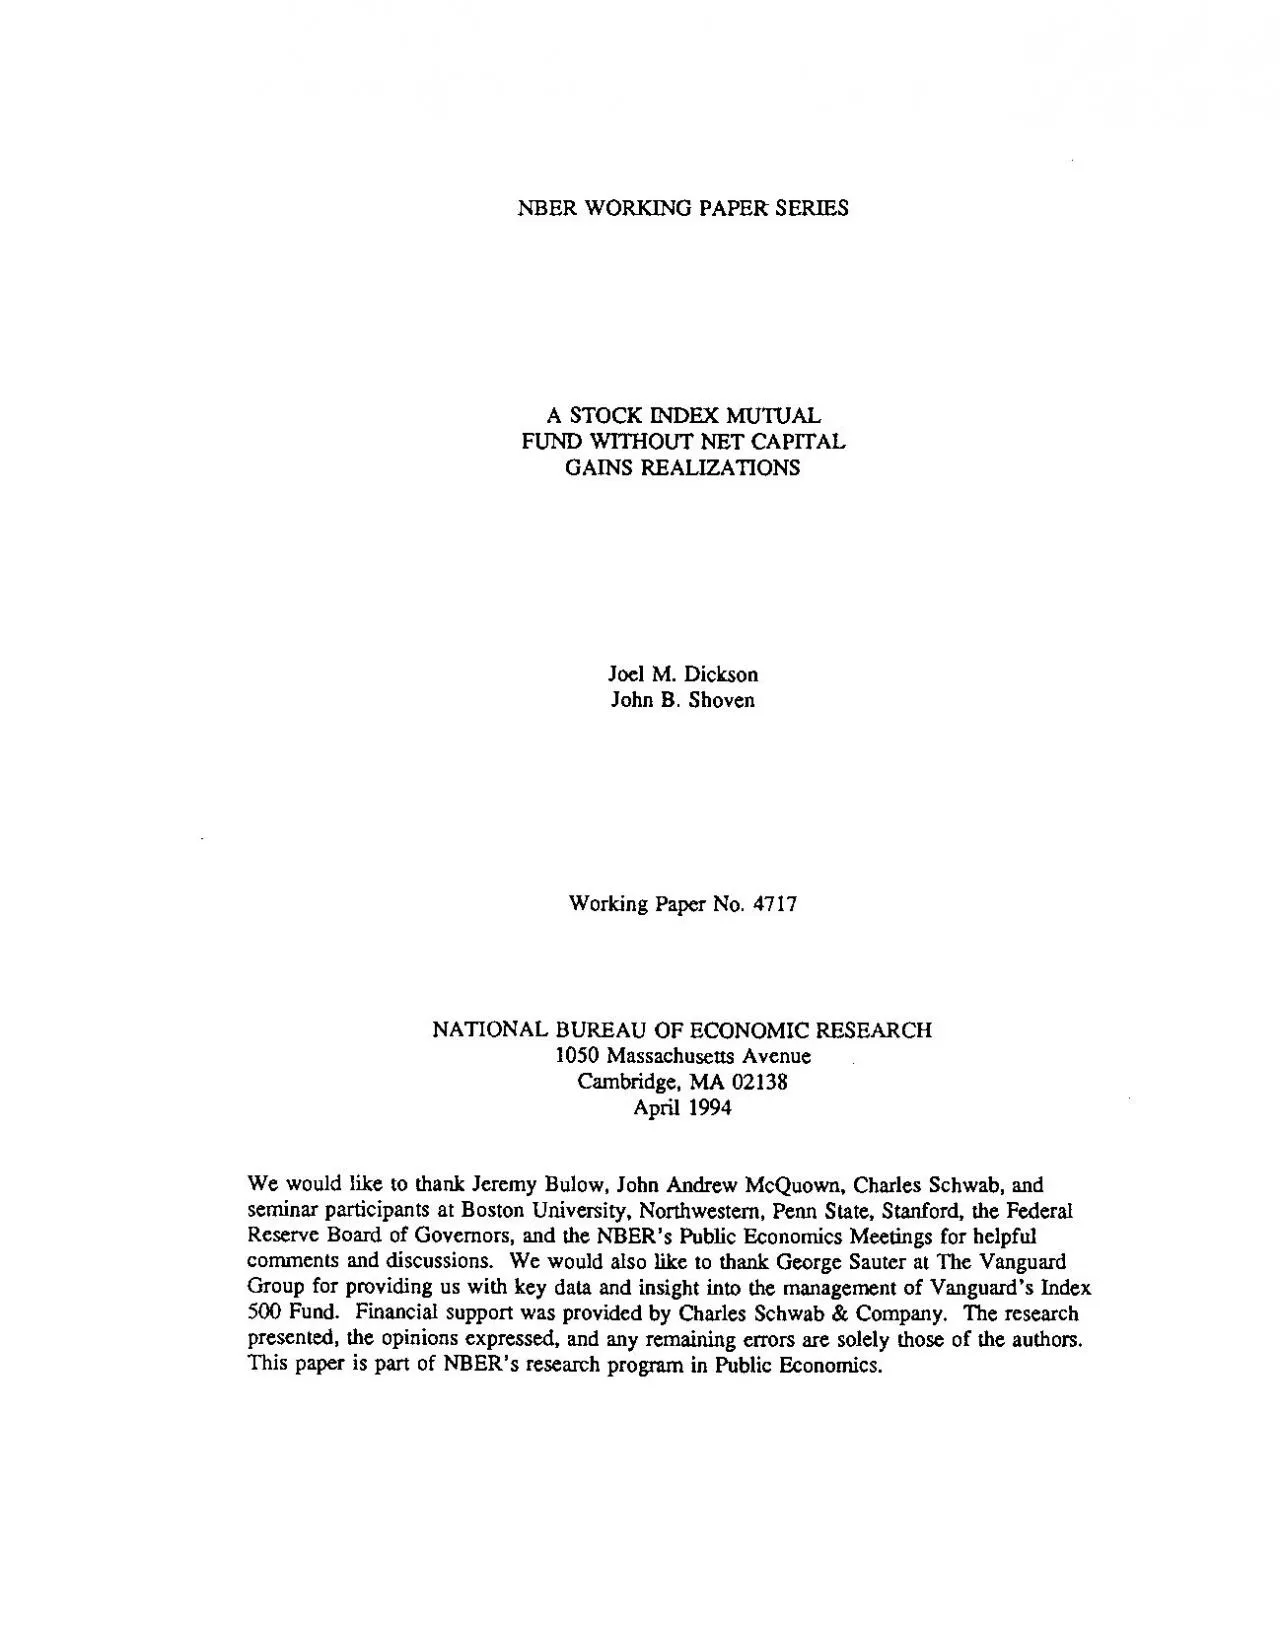
/
NBER WORKING PAPER SERIESA STOCK INDEX MUTUALFUND WITHOUT NET CAPITALG NBER WORKING PAPER SERIESA STOCK INDEX MUTUALFUND WITHOUT NET CAPITALG

NBER WORKING PAPER SERIESA STOCK INDEX MUTUALFUND WITHOUT NET CAPITALG - PDF document

natalie
natalie . @natalie
Follow
346 views
Uploaded On 2021-06-16

NBER WORKING PAPER SERIESA STOCK INDEX MUTUALFUND WITHOUT NET CAPITALG - PPT Presentation

NBER Working Paper 4717April 1994A STOCK INDEX MUTUALFUND WITHOUT NET CAPITALGAINS REALIZATIONSABSTRACTThis paper reconsiders the literature on tax options by examining the ability to defer netcapita ID: 843234

tax fund funds capital fund tax capital funds gains index 500 hifo surge open closed strategy security vanguard securities

Share:

Link:

Embed:

Download Presentation from below link

Download Pdf The PPT/PDF document "NBER WORKING PAPER SERIESA STOCK INDEX M..." is the property of its rightful owner. Permission is granted to download and print the materials on this web site for personal, non-commercial use only, and to display it on your personal computer provided you do not modify the materials and that you retain all copyright notices contained in the materials. By downloading content from our website, you accept the terms of this agreement.


Presentation Transcript

1 NBER WORKING PAPER SERIESA STOCK INDEX M
NBER WORKING PAPER SERIESA STOCK INDEX MUTUALFUND WITHOUT NET CAPITALGAINS REALIZATIONSJoel M. DicksonJohn B. ShovenWorking Paper No. 4717NATIONAL BUREAU OF ECONOMIC RESEARCH1050 Massachusetts AvenueCambridge, MA 02138April 1994We would like to thank Jeremy Bulow, John Andrew McQuown, Charles Schwab, andseminar participants at Boston University, Northwestern, Penn State, Stanford, the FederalReserve Board of Governors, and the NBER's Public Economics Meetings for helpfulcomments and discussions. We would also like to thank George Sauter at The VanguardGroup for providing us with key data and insight into the management of Vanguard's Index500 Fund. Financial support was provided by Charles Schwab & Company. The researchpresented, the opinions expressed, and any remaining errors are solely those of the authors.This paper is part of NBER's research program in Public Economics. NBER Working Paper #4717April 1994A STOCK INDEX MUTUALFUND WITHOUT NET CAPITALGAINS REALIZATIONSABSTRACTThis paper reconsiders the literature on tax options by examining the ability to defer netcapital gains realizations within an equity portfolio whose constituents change over time. Unlikeprevious studies on the value of tax options, this paper examines after-tax returns to shareholderswithin an equity mutual fund. The mutual fund context allows certain features of the UnitedStates' tax laws --namely,wash-sale rules and the offsetting of short-term and long-term capitalgains and losses --tobe incorporated in assessing

2 the potential improvement in post-tax re
the potential improvement in post-tax returnsto investors engaging in tax minimization strategies.Specifically, this paper examines the feasibility of managing open-end and closed-endStandard and Poor's 500indexfunds which defer net capital gains realizations. A combinationof HIIFO (highest in, first out) accounting procedures and the systematic booking of significantlosses in portfolio constituents would have allowed the open-end fund variant to match the annualpre-tax return of Vanguard's Index 500 Fund while improving annual after-tax performance byas much as ninety-seven basis points through the elimination of all capital gains realizationsbetween 1977 and 1991. Deferring capital gains is shown to be easier for open-end fundsrelative to closed-end funds while the additional turnover required to implement these strategiesis quite modest. The authors name the tax-sensitive funds in this paper "SURGE (StrategiesUsing Realized Gains Elimination) funds."Joel M. DicksonJohn B. ShovenDepartment of EconomicsDepartment of EconomicsStanford UniversityStanford UniversityStanford, CA 94305Stanford, CA 94305and NBER A Stock Index Mutual Fund Without Net Capital Gains RealizationsMutual fund prospectuses provide a great deal of information about the operation, style,investment philosophy, and past performance of funds. These disclosures, most required by theSecurities and Exchange Commission, are meant to provide prospective investors with thenecessary information to compare mutual funds in order to

3 make informed financial allocationdecis
make informed financial allocationdecisions. One principal drawback of the current disclosure laws, however, is that allperformance data are reported as pre-tax values even though many shareholders are subject tofederal, state, and local taxation on the dividend and realized capital gains distributions madeby different funds.Many popular sources of investment analysis and advice, such as financial newspapers andmagazines, use the pre-tax measures to rank the past performance of mutual funds. Dickson andShoven (1993), however, find that tax management policies across equity mutual funds differwidely, causing the post-tax rankings to deviate significantly from their pre-tax counterparts.Even if past before-tax performance may not be indicative of future before-tax performance, theafter-tax calculations allow investors to identify better those funds which systematically managetheir portfolios to minimize their shareholders' current tax liability by taking advantage of theability to defer taxation until capital gains are realized.Some mutual funds recognize the importance of maximizing after-tax returns for theirinvestors. The prospectus of the Schwab 1000 Fund, for example, states that 'the Fund'sinvestment policies are designed to minimize current capital gains tax liability" (p. 4).Furthermore, Dickson and Shoven (1993) show that if an index fund, such as Vanguard's Index 500 Fund which replicates Standard and Poor's 500 Stock Index (S&P 500),couldmanage itsportfolio to eliminate all capit

4 al gains distributions to its shareholde
al gains distributions to its shareholders, after-tax performancewould have been greatly enhanced.In this paper, we consider the feasibility of creating and implementing a tax-conscious"index" fund which eliminates all realized capital gains distributions for long horizons. Theaccounting and trading strategies used to minimize realized capital gains taxes in our stockportfolio are motivated with the theoretic research on capital gains tax minimization byConstantinides (1983) and Stiglitz (1983). Our specific aim is to replicate the S&P 500 indexfrom August, 1976, when Vanguard's Index 500 Fund commenced, through December, 1991.We name our constructed fund a SURGE fund (Strategies Using Realized Gains Elimination) andconsider both closed-end and open-end SURGE variants.The analysis in this paper provides a number of interesting additions to the literature on thevalue of tax options. Constantinides (1984) and Dammon, Dunn, and Spatt (1989) considertrading strategies on individual stocks which have survived for some specified time period. Byfocusing on the S&P 500,wecan analyze the benefits of tax-motivated trading within a portfolioof stocks whose constituents are changing over time (i.e., forced realizations) and whereonlynet capital gains on the entire portfolio are considered. In addition, simulations of closed-endand open-end S&P 500 mutual funds allow insight about the advantages of competing investmentcompany structures to engage in tax-minimization strategies.A number of additional qu

5 estions must also be addressed. First, i
estions must also be addressed. First, is the fund we create ableto track the S&P 500 successfully? That is, are we able to match the annual pre-t.ax return whileimproving after-tax performance relative to a mutual fund which completely replicates the index?2 Second, will the trading strategies we examine eliminate realized capital gains distributions overlong periods of time even as the proportion of unrealized gains in our portfolio grows? Finally,offsetting realized gains with realized losses implies that, relative to a true index fund, a SURGEfund's turnover rate will be higher. Do the costs associated with the increased turnoveroutweigh the benefits of eliminating gains distributions? In other words, are the transaction costsassociated with SURGE funds prohibitively high?The paper proceeds as follows. Section I details the methodology of implementing ourSURGE fund. Section II describes the data we used to create our variant of an S&P 500 indexfund. Section III presents the results of our analysis and focuses on the ability of SURGE fundsto enhance after-tax performance for shareholders and also discusses differences between closed-end and open-end funds which exhibit exactly the same investment strategies and management.Section IV concludes and summarizes.I. MethodologyWe choose to create our so-called SURGE fund based on the S&P 500 index for two mainreasons. First, the S&P 500 is constantly used as the benchmark against which equity mutualfunds are measured. Second, it would be rela

6 tively simple to construct a stock portf
tively simple to construct a stock portfolio, ex-post, which is able to offset realized gains with realized losses for long horizons. Confiningourselves to the S&P 500 firms, however, facilitates straightforward pre-ta.x comparisons withthe benchmark while restricting our available trading strategies.The strategies examined in our simulations below rely on the ability of an investment3 manager to minimize net capital gains realizations for his/her shareholders. One relevantinstitutional feature regarding regulated investment companies (RICs) must be emphasized'.Unlike individual shareholders who, under current tax laws, may deduct net capital lossestotalling up to $3000 per year from ordinary income, RICs cannot distribute net capital lossesto their shareholders. In addition, individual investors may carryforward capital lossesindefinitely to offset future capital gains realizations while RICs may carryforward net realizedlosses for eight years following the loss year. RICs distribute both short-term and long-termcapital gains, if necessary, but any losses offset either short-term or long-term realized capitalgains dollar for dollar.The general construction of these SURGE funds allows for the accounting practice ofspecific identification in the sale of securities. Dividends and other income received fromdistributions, left-over cash from additions and deletions from the index, and, in the case ofopen-end SURGE variants, net sales data are combined with the current portfolio at the end ofea

7 ch month. Anytime a particular security
ch month. Anytime a particular security is purchased, we record the number of sharesbought, the purchase date, and the price paid per share. We have, therefore, many differentstock "slices" with many different bases for a given security in our portfolio.Technically, a "mutual" fund is an open-end regulated investment company. Closed-endfunds are not "mutual" funds. We will, however, tend to use regulated investment company andmutual fund interchangeably.4 At a given time t, the value of our S&P 500 portfolio can be expressed asN1EL "it5vi-i1-1where P.,is security i's price at time t, N is the number of "slices" of security i held at t, andis the number of shares held in the jth slice of security i. The basis of the portfolio at timet may be similarly expressed asncN,E L Ps(1)1—1 f—Iwhere Po is the per-share purchase price of the jth slice of security i.HIFO Accounting ProcedureThere are two strategies we will use to try to eliminate net capital gains realizations. Thefirst strategy is that whenever a portion of a security's holdings must be sold, we always sell thehighest basis shares first. If our fund must sellshares of security i at time t, then, using thenotation of equation (1), the fund will sell the slice S corresponding to the per-share price:max{ P ; j =1,...,N }2. The HIFO (highest in, first out) strategy is implemented when shares2 If L is greater than the number of shares contained in sliceS with the highest per-sharebasis, then we just continue choosing the highest basis slice

8 s until all Lg shares are sold.5 must be
s until all Lg shares are sold.5 must be sold due to re-weightings of the index not resulting solely from share price movements(e.g., share repurchases) or, in the case of our open-end SURGE funds, when a monthly ebbof money must be met by selling some of the current stock holdings3. The HIFO accountingprocedure does not alter the true portfolio weights in any manner. All that the HIFO approachdoes is target which tax lot of a security to sell conditional on a sale being required. Huddartand Narayanan (1993) use the HIFO approach in their study of tax motivated trading byinstitutional investors such as mutual funds.Realizing Capital LossesThe second tax advantaged strategy is for our fund to realize capital losses to offset futurecapital gains liabilities. Booking capital losses mitigates the effects of forced realizations thatmay result in capital gains income (e.g., cash mergers). Constantinides (1983) shows that in thepresence of no transaction costs and a realization tax on capital gain income (with no differencebetween short-term and long-term gains tax rates), individual investors would optimally realizelosses as they accrue while deferring all gains. A simple example illustrates the advantage ofthis approach. Suppose a security sells for $10 at time 0, $5 at time 1, and $10 at time 2. If'Onemay also consider implementing a modified }HFO approach where a distinction ismade between short-term and long-term capital gains. If every investor in the fund is subjectto a thirty-six percent

9 marginal tax rate on short-term capital
marginal tax rate on short-term capital gains and a twenty-eight percentrate on long-term gains, then investors would prefer up to a $1. 125 ((1-.28) I (1-.36)) long-term gain for each $1 short-term capital gain. We do not implement this modified HIFOapproach since, in all of our simulations, we never a distribute a net short-term gain and, inmost simulations; we never distribute a net capital gain (i.e., we carryforward losses whichwould be used up faster under this modified HIFO procedure).6 an investor would have sold and repurchased the securityat time 1 (without transaction costs),she would have a $5 loss to offset either the gain from time 1 to time 2 (if the security is soldat time 2) or gains in other parts of her portfolio. A buy and hold strategy in this case wouldobviously be inferior: the value of the portfolio is the same but there is no option available tooffset gains in the rest of the investor's portfolio in the event of a forced liquidation.Another example is provided by Figure 1 which shows that redundant securities on a pre-taxbasis can imply very different post-tax results for an investor's portfolio. As depicted in Figure1, consider a $1 investment in a security which appreciates 10% in one state of the world(occurring with probability p) and appreciates 5%inall other states of the world (withprobability 1-p). This security can be replicated by a $0.50 investment in a security whichappreciates 30% in one state of the world and depreciates 10% in all other states and an

10 other$0.50 investment in a security whic
other$0.50 investment in a security which depreciates 10% in the first state and appreciates 20% inall other states. While the pre-ta.x returns are identical, an opportunity to realize a capital lossto offset capital gains in the investor's portfolio does not exist with the first security since itappreciates in value in all states of the world. One of the replicating securities, however, isguaranteed to depreciate in value over each period and, therefore, an investment made at thebeginning of the period could be sold at a capital loss (in the absence of transaction costs) andused to offset gains in other parts of the portfolio. Figure 1 demonstrates Constantinides' (1983)point that higher variance securities have larger tax option values because of the increasedlikelihood of realizing a loss position.7 Wash-Sale Restrictions on Realizing Capital LossesThe biggest impediment in implementing this strategy of realizing losses as they accrue isthe wash-sale rule. A wash sale disallows the realizatiOn of a capital loss if the security whichwas sold at a loss had been purchased within the preceding thirty days. The wash sale rule alsoapplies if the security sold at a loss is repurchased within the thirty days following the sell date.If a loss is disallowed, a basis and holding period adjustment is made to another slice of thatsecurity's holdings4.Without the wash sale rule, a fund could sell and immediately repurchase a position whosebasis is higher than its current market value, thereby booking

11 a capital loss without deviatingfrom th
a capital loss without deviatingfrom the fund's current portfolio weights. One obvious strategy for dealing with wash sales isto purchase a security or combination of securities with similar expected return and riskcharacteristics to replace the stock which is sold at a loss. This possibility provides one potentialjustification, even if money managers are unable to "beat the market," for more activelymanaged funds. An index fund is restricted to investments in the index's constituents. If asecurity is sold to realize a capital loss, an index fund must remain underweighted in thatsecurity (and possibly overweighted in the other securities) relative to the true index weights forAn example of the wash-sale rule might provide some insight. Suppose an investorpurchases 100 shares of a security on December 1, 1993, at $30 per share. Another 100 sharesare purchased at $35 per share on January 3, 1994. On January 24, 1994, the investor wantsto sell the shares purchased January 3 at a current share price of $32. The loss of $3 per sharewould be disallowed. The basis of the remaining 100 shares would become $33 ($30 plus the$3 loss disallowed) with a purchase date of November 10, 1993 (December 1 minus the 21 dayholding period that the wash sale lot had been held).8 thirty days before a purchase could be made to re-establish the index weights5.Unlike the individual trading strategies considered in Constantinides (1983,1984) andDammon, Dunn, and Spatt (1989), the wash sale rule complicates the notio

12 nof optimallyrealizing losses in the cas
nof optimallyrealizing losses in the cases of closed-end and open-end index equity funds. The strategyofrealizing losses for our SURGE funds is subject to a tradeoff between tracking the underlyingindex (i.e., pre-tax return) and the desire to realize capital losses as they accrue. As an extremeexample, consider the case where we have a loss position in at least one sliceof every securityin our portfolio, and we have a net inflow of cash during the month. If we realize every lossposition, we could not buy any of the securities because of the washsale rule, and the cashinflow and money received from the stock sales would have to remain as cash until the followingmonth6. Such a strategy would most likely inhibit pre-tax equity returns to the point where thetax savings could not offset the loss in total return.We view the decision to sell loss positions and temporarily deviate from the index weightsas a function of three variables: the difference between the current share priceand the originalbasis (the trigger), the degree to which we allow underweighting of a given security, and thepercentage of our total holdings subject to the loss trigger.In all of the SURGE fundsIn the construction of our SURGE funds below, we use monthly buys or sales of securitiesand modify the wash sale rule by disallowing a purchase and sale of a security in the samemonth. If you sold a stock at the end of the previous month, however, you may purchase thatsecurity at the end of the current month. In most cases our w

13 ash sale periodwill be 30 or 31days exce
ash sale periodwill be 30 or 31days except for February where our wash sale period will generallybe 28 days.6 A mutual fund would not be restricted from selling shares entirely. A fund can "sellthrough" the wash sale and account for that portion of the sale subject tothe wash saleprovisions in a manner similar to the example presented in footnote4. In our replications,however, we do not "sell through" any wash sales.9 considered in this paper, the trigger for a loss sale is a current share price which is no more than75 percent of the basis, and, we must be able to sell at least five percent of our total holdingsin the security at or below the 75pereenttrigger. The five percent minimum is chosen torepresent the level at which realizing losses offsets the monthly deviation from the true indexweights. We furthermore require that we are never underweighted in any single security bymore than 50percentrelative to the true index weights. We refer to this strategy as the 5-50-75tradingrule7. If a sale of securities would meet all three of these conditions, then we realizethe loss at the end of the current month and do not re-establish the market weights until the endof the following month8.H. DataThere are a number of data sources that must be compiled in order to create a S&P 500indexed mutual fund. We first obtained a database of all the constituents of the S&P 500 fromStandard and Poor's (S&P). This database includes the day of a firm's insertion and deletion(if applicable) in the S&P 500 from

14 the inception of the index in March, 195
the inception of the index in March, 1957. Using S&P's'Thesenumbers are chosen somewhat arbitrarily, and we make no claim that this is an"optimal" strategy. An optimal strategy would depend on the shareholders' preferences withrespect to the overweighting and underweighting of securities in the index. Results presentedbelow are robust to deviations in the trigger values and share holding restrictions.8Thisstrategy of realizing losses is similar to strategy 1 in Constantinides (1984). We donot consider the other trading strategies in Constantinides (1984) and Dammon, et.al.(1989)since these involve a restarting option where a long-term gain is realized to re-establish a short-term position. Since we never end a year with a net short-term capital gain in any of ourreplications and RJCs cannot distribute capital losses, the restarting option will, most likely,provide no additional benefit to after-tax returns in our SURGE funds.10 list, we pulled stock market return data for each S&P 500firmfrom the Center for Researchin Security Prices (CRSP) daily stock price database.For each firm in the index between July 31, 1976, and December 31, 1991, (the last dayof CRSP data available to us) we use CRSP to obtain all price, shares outstanding, anddistribution data. CRSP codes all distributions to shareholders of a particular security by type(e.g., dividend, merger, split) and tax status (e.g., taxable as ordinary income, non-taxable,return of capital). Non-taxable mergers and spin-offs might be taxab

15 le for our purposes sincethe stock recei
le for our purposes sincethe stock received may not be a security in the S&P 500 index. All non-taxable distributionsof stock as coded in CRSP are verified in Capital Changes Reporter published by CommerceClearing House. When the securities received are not contained in the 500 index, the per-sharedollar amount of the distribution is treated as a sale of stock subject to capital gains or losses.Table 1 shows how deletions have affected the S&P 500 index for the period from August1, 1976, to December 31, 1991. For each calendar year, the table reports the total number ofdeletions and the sum of the percentages of the S&P 500 that these firms totalled at the time ofexit from the S&P 500.Thereare a total of 317 deletions (and additions) to the S&P 500 overour sample period for a combined total of 817 firms in the S&P 500 index over this timehorizon. The merger and take-over rage of the mid and late 1980s is apparent in Table 1. Atotal of 89 firms, accounting for approximately one-eighth of the index's market capitalization,were deleted from the index in the 1984-1986 period.There are a number of differences between the dates that a firm is included in the S&P 500as provided by Standard and Poor's and the dates that a firm has CRSP data available. Almostall of the discrepancies concern delisting dates. The committee that makes decisions about11 additions and deletions to the S&P 500 meets only on an occasional basis. If a firm were todelist because of merger or bankruptcy, CRSP data would be a

16 vailable through the security'slast trad
vailable through the security'slast trading day. On the other hand, the S&P 500 committee might not replace the delistedsecurity in the index for a week or more depending on the scheduling of the next committeemeeting. While the S&P 500 always consists of 500 firms, therefore, our constructed index maycontain, at times, slightly fewer firms9.In order to replicate an open-end S&P 500 index fund, we need some representative net salesdata. We obtained from The Vanguard Group actual monthly net sales for the Vanguard Index500 Fund since its inception in August, 1976. The frequency of the net sales data determineshow often we buy and sell shares for our SURGE fund's portfolio. Except for additions anddeletions which occur on specific days within a given month, we make purchases or sales ofstock based on Vanguard's monthly net sales at the end of each month.ifi. ResultsWe consider two types of closed-end and open-end SURGE funds. The first type, "HIFOonly," maintains the S&P 500 market capitalization weights at all times. The "HIFO only"strategy simply sells the highest basis shares when the fund is forced to sell some of theportfolio's holdings. The second type of SURGE fund, "HIFO, 75%," also follows the HIFOAnother difference is the treatment of the AT&T divesture. The S&P 500 added theseven baby bells on November 30, 1983. CRSP data for the baby bells, however, do not beginuntil February 16, 1984. The CRSP data for AT&T between these dates implicitly contain thereturns for the baby bells eve

17 n though our replicated index fund will
n though our replicated index fund will explicitly contain only 493firms over this period.12 strategy with respect to portfolio sales. The "HIFO, 75%" strategy, in addition, searchesthrough the portfolio at the end of every month for bundles of securities which may be sold torealize capital losses. As described in the methodology section above, a loss is realized if thebundle meets the trading rule where at least 5 percent of a stock's holdings, subject to beingunderweighted by a maximum of 50 percent, can be sold at a current price not greater than 75percent of the cost basis. The SURGE "HIFO, 75%" fund will deviate from the market weightsfor the month in which a loss is realized in order to satisfy the wash sale restrictions. Theexcess cash that would have been used to establish the index weights in the stock which was soldat a loss is distributed across all the securities not subject to the wash sale provisions accordingto the index weights.The closed-end SURGE funds participate in an initial public offering on July 31, 1976, inwhich they offer one million shares at a per-share price of ten dollars. The closed-end SURGEfunds are assumed to trade at their net asset values (NAV) at each point in time'°. The open-end SURGE variants also commence operations on July 31, 1976, with initial assets of tenmillion dollars and a $10 NAy. As an estimate of the expenses that each of our SURGE fundsincurs, we subtract the annual expense ratios published by Morningstar for the Vanguard Index500 Fund.

18 At the end of each calendar year, each S
At the end of each calendar year, each SURGE fund distributes an ordinarydividend" and a long-term capital gain dividend to its shareholders. We assume that all'°Thereis a large finance literature on the paradox of closed-end investment companiestrading at prices not equal to their NAVs (see Lee, et.al. (1990) for a general discussion ofclosed-end anomalies). Since we have no way to characterize the prices at which our closed-endfunds would trade, we assume the share prices always equal the NAVs."Theordinary dividend includes any net realized short-term capital gains.13 distributions are re-invested in new fund shares.All of our funds invest 100percentof their total assets in the S&P 500 securities subject tothe following exceptions. The funds purchase an integer number of shares of each stock. Anyfractional shares are held as cash. Dividends and other distributions received during the monthare held as cash until the end of the month when new shares can be purchased. Cash receivedfrom the deletion of a security is held until a new security is added to the index. Because ofdifferences in CRSP delisting dates versus the S&P 500 index deletion dates, we may have tohold a cash position from a deletion for two weeks or more. All cash earns the short-termTreasury Bill rate as found in Ibbotson (1993).The results for our open-end and closed-end SURGE funds are presented in Tables 2 and3, respectively. We present results for the five, ten, and fifteen year periods ending onDecember 31, 1991. For t

19 he open-end SURGE funds, the actual retu
he open-end SURGE funds, the actual returns for Vanguard's Index500 are reported for comparison purposes. The tables report the end-of-period value of a onedollar investment made at the beginning of the period in each of the funds, the average annualpercentage nominal return, and, for the open-end variants, the percentile rank of the fund in the147 open-end, equity mutual funds considered by Dickson and Shoven (1993). Return data arepresented on a pre-tax, mid-tax, and high-tax basis. The mid-tax and high-tax returns arecalculated for a taxable investor facing income and long-term capital gains marginal tax ratesbased on three and ten times annual median adjusted gross income, respectively'2. Tables 212SeeDickson and Shoven (1993a) for a more detailed description of these hypotheticalmid-tax and high-tax investors.14 and 3also report the average annual portfolio turnover rates'3 for each of the variantsconsidered over the relevant time period.Open-EndFund ResultsThe results in Table 2 for our tax-conscious, open-end SURGE funds are quite dramatic.On a pre-tax basis, our SURGE funds and Vanguard's Index 500 Fund match almost exactly.In other words, there seems to be no tracking error. This hypothesis is confirmed by Figure 2which shows that our SURGE funds offer essentially identical annual pre-tax returns asVanguard's Index 500 each year. On a post-tax basis, however, our S&P 500 index fundsperform much better than Vanguard's S&P 500 index fund'4. The high-tax individual earnsan annual ret

20 urn approximately 85-95 basis points hig
urn approximately 85-95 basis points higher than the Vanguard 500 with ourSURGE funds over the ten and fifteen year horizons. The mid-tax individual sees annual returnincreases on the order of 65-70 basis points. By improving post-tax returns without altering pre-tax results, these SURGE funds are appropriate alternative investment vehicles to traditionalindex funds for all investors regardless of the tax status of the shareholders' investment.The numbers in parentheses in Tables 2 and 3 represent the corresponding liquidation valuesat the end of the five, ten, and fifteen year periods. The liquidation value is the amount an13 The portfolio turnover rate is the smaller of sales and purchases of securities madebythe fund divided by the fund's average total assets.14 The reader should note that Vanguard's Index 500 is already an excellent fund for taxableinvestors as seen by the substantial increases in the post-tax versus pre-tax rankings for everytime horizon.15 investor would have if he would have sold his shares at the end of 1991 and paid taxes on anypreviously unrealized capital gains. Even on a liquidation basis, the long-term deferraladvantage of capital gains taxes is evident. Over the 1977-1991 period, an investor in our open-end SURGE HIFO, 75% fund would have had an after-tax return 54 basis points per year higherthan that achieved by Vanguard's Index 500.While return differences are not as dramatic under the liquidation scenario, the liquidationvalue represents the worst-case sc

21 enario. An investor can always leave a f
enario. An investor can always leave a fund with no morethan his accrued capital gains being realized. Consider an investor having purchased a fund witha $10 net asset value, but the next day the fund distributes a $5 realized capital gain. If theinvestor immediately sells the mutual fund shares (which have fallen to a $5 NAV because ofthe distribution), then there is no taxable event since the gain and loss will offset each other.The liquidation value can understate the tax deferral advantage because of the step-up in basisat death or if the mutual fund shares are given as a gift.One of our most intriguing results is that nearly all of the improvement in the post-taxreturns results from the simple HIFO only strategy. In this case, the index weights are alwaysmaintained since this fund does not engage in additional trading to offset realized gains bybooking losses. Taxable investors in our open-end SURGE funds gain only an additional 5-8basis points per year by combining the HIFO and 5-50-75 trading strategies relative to the HIFOonly approach. Investors in more actively managed funds which hold fewer tax lots andturnover their portfolios at greater rates would more likely see more improvement from realizingcapital losses since the HIFO only approach works extremely well for an index fund with manytax lots in a relatively fixed universe of securities.16 There are a number of possible explanations for why our HIFO only strategy outperformsVanguard's Index 500onan after-tax basis. One possib

22 le explanation would be that Vanguardsel
le explanation would be that Vanguardsells shares of those companies participating in non-taxable mergers where the resulting firm isalso in the 500 index and purchases the new securities instead of participating directly in thestock swap. We regard this explanation as highly unlikely. Another plausible explanation isthat, according to experts within the mutual fund industry, shareholders put a premium ondistributions made by a given mutual fund even if it results in additional tax consequences.Mutual funds, therefore, might try to increase realized capital gains distributions to convinceshareholders that their investment is performing well. Our conversations with Vanguard,however, indicate that the Index 500 always maintains its passive investment strategy and nevertries to increase distribution amounts. This explanation for differences in our results relative toVanguard's Index 500, therefore, is highly unlikely.The most obvious explanation would be that Vanguard uses an accounting procedure otherthan HIFO when it sells securities. This fact has been confirmed in our discussions withVanguard. The Index 500 uses specific invoicing in the sale of securities but sells the bundlewith a cost basis closest to the average cost basis of that security's holdings. Much of thedifference between capital gains realizations can be attributed to the HIFO accounting procedurethat we use in the construction of our SURGE funds. Another explanation for some of thediscrepancies between our simulated funds a

23 nd Vanguard's Index 500 may be due to th
nd Vanguard's Index 500 may be due to thefrequency of trading. Because we have access only to monthly cash flow data, wemake salesor purchases of securities based on the accumulation of daily net sales figureswithin a givenmonth. In actuality, Vanguard makes both sales and purchases within a given month in response17 to daily cash flows. This point is discussed in more detail below.We feel the impressive post-tax performance of our HIFO only approach is also a result ofour strategy of meeting monthly ebbs of cash by selling securities15 Most equity mutual fundsmeet net redemptions either by dipping into a small cash reserve (typically 2-5percentof totalassets) or by using lines-of-credit instead of selling securities. Paying exiting shareholdersthrough cash reserves or very short-term borrowing allows equity funds to maintain their existingportfolios. Our HIFO only strategy, however, is consistent with the notion that occasional ebbsactually can be beneficial to the remaining shareholders if the fund is able to sell off some ofits unrealized loss positions. The usual argument that net redemptions are harmful because ofrealized gains liabilities resulting from the sale of securities (see Jeffrey and Arnott (1993)) isbased on the assumption of calculating gains with respect to the average appreciation of thesecurities. Such an assumption does not recognize the ability to use specific invoicing in thebundles of securities to be sold.Open-End v. Closed-End Fund Tax SensitivityThe net redemptio

24 n gains argument is also promoted as a d
n gains argument is also promoted as a disadvantage of open-end fundsrelative to its closed-end counterparts (Jeffrey and Arnott (1993)). Closed-end funds, theVanguard's Index 500 does not currently attempt to pay exiting shareholders through theexistence of a cash reserve. We do not have, however, any data on the cash component of theIndex 500 portfolio at all points in time. Even so, the discussion of post-tax performance in ourfunds which do not use cash reserves to meet net redemptions is meant as a general commentand not specifically aimed at explaining differences between our results and Vanguard's actualexperience.18 argument states, never experience ebbs of money and, therefore, sell portions of their portfoliosonly in response either to changes in the index weights resulting from increases or decreases inshares outstanding or to changes in the index's constituents. This argument ignores the fact thatwhile closed-end funds do not have ebbs, flows of new money are also limited. The net salesof open-end equity funds in general and Vanguard's Index 500inparticular dwarf the amountof money received by both open-end and closed-end funds each month through securities'distributions such as dividend payments. The ability to invest large amounts of "new" moneyfrom net sales in an open-end fund provides substantially more slices of securities which, onaverage, have a higher basis than the securities in a closed-end fund if share prices rise overtime. When securities must be sold, therefore,

25 the open-end fund will most likely reali
the open-end fund will most likely realize alower percentage of capital gains relative to basis value than its closed-end counterpart.Our claim that open-end funds outperform their closed-end equivalents for taxable investorsis borne out in Table 3. Our closed-end SURGE funds yield the same (or even slightly better)pre-tax performance yet lose more of their return to taxes. On average, the closed end fundslose 20-40 basis points per year relative to our open-end funds for mid-tax and high-taxinvestors. One interesting result is that our strategy of booking losses makes a much largerdifference in the post-tax returns for our closed-end funds than for the open-end funds. Ourstrategy of realizing large capital loss positions increases post-tax returns by as much as 27 basispoints per year over the HIFO only closed-end fund.The finding that booking losses is more beneficial in closed-end funds is consistent with ourargument that closed-end funds are more tax disadvantaged. First, since there are no ebbs ina closed-end fund, potential loss positions remain unrealized since HIFO procedures are less19 likely to be implemented. Second, as security prices rise over time, the lack of new moneyflowing into the funds to provide additional, and, on average, higher bases, ensures that HIFOprocedures, when implemented, will result in more realized capital gains for the closed-end fundthan in equivalent open-end variants. By realizing losses with a simple trading strategy, we arebetter able to realize los

26 s positions in the closed-end funds to o
s positions in the closed-end funds to offset future capital gains.Tables 2 and 3 also report the average turnover rates for each strategy While stillextremely low by industry standards'6, the strategy of booking losses does increase portfolioturnover rates relative to a less aggressive trading strategy. For our open-end SURGE funds,for example, average turnover increased from 10.99 percent of average assets per year for the"HIFO only" strategy to 17.57 percent per year for the "HIFO, 75%" strategy over the ten-yearperiod 1982-1991. Even though turnover increases with our 5-50-75 trading rule, theimprovement of up to 95 basis points per year on the return for taxable investors would not beoffset by the extra costs associated with the incremental rise in turnover rates.As previously mentioned, Vanguard's Index 500 engages in higher frequency trading thanour SURGE funds since we did not have access to Vanguard's daily cash flow history. Higherfrequency trading most likely accounts for the differences in turnover rates between our "HIFOonly" fund and Vanguard's Index 500 Fund. Implicitly, of course, our pre-tax returns reflectthis discrepancy since we subtracted Vanguard's actual expense ratio (which is based on theirturnover experience) from our annual returns calculations. On a post-tax basis, daily tradingactivity on Vanguard's part may result in additional differences with our SURGE funds. Positive16Theaverage annual turnover rate for equity mutual funds is about 100 percent of averageass

27 ets.20 net sales within a given month, w
ets.20 net sales within a given month, which would result in a purchase of securities for our SURGEfunds, might have been generated by many large daily net sales and a few daily net redemptions.The sale of securities to meet a daily net redemption could result in more capital gainsrealizations. This is especially true for Vanguard's Index 500 since it does not use a HIFOidentification strategy. We believe that higher frequency trading helps explain a portion ofVanguard's larger capital gains realizations; however, because of HIFO accounting, we do notbelieve that applying our SURGE strategies to daily portfolio management would force us intorealizing any additional net capital gains.Annual Statistics for Open-End and Closed-End VariantsTables 4 and 5 present annual summary statistics for our open-end and closed-end SURGEfunds, respectively. These tables report the year-end NAV along with annual pre-tax totalreturns, dividend payments per share, long-term capital gains distributions per share, turnoverrates, and year-end total assets (in millions). In addition, we report the end-of-year value ofcapital loss carryovers, unrealized capital losses, and unrealized capital gains as percentages ofyear-end assets. Table 6 reports NAy, pre-tax return, dividends, long-term capital gains, andturnover rates for the Vanguard Index 500 as taken from Morningstar'7.Comparing Tables 4 and 6 shows how our open-end, HIFO only strategy improves onVanguard's experience. The Vanguard Index 500 has distributed l

28 ong-term capital gains everyThe NAV numb
ong-term capital gains everyThe NAV numbers are not directly comparable between our funds and Vanguard's Index500 since our funds began with different NAVs.21 year since 1979. Our "HIFO only" SURGE fund does not make a capital gains distribution until1984. Over the fifteen year period from 1977-1991, the "HIFO only" SURGE fund makescapital gains distributions in only four of those years. By deferring the realization of capitalgains into the future, our HIFO only fund allows its shareholders to earn more of its returnthrough increases in NAV (unrealized capital gains) than in realized gains distributions.Table 4 also shows that when we combine a HIFO strategy with our 5-50-75 trading rule,all realized capital gains distributions are eliminated for the entire 1977-1991 period. Themarket crash of 1987 was especially beneficial for our desire to realize capital losses as weended the year with a loss carryover of nearly eleven percent (approximately 84 million dollars)of our total assets. Another interesting fact is that even though our total returns were 16.03percent in 1988 and 31.21 percent in 1989, our loss carryovers from 1987 easily offset allrealized capital gains. Our HIFO only fund, however, was not able to offset gains in 1989 andhad to make a 33 cent per share capital gains distribution.We have been able to eliminate all realized capital gains distributions since 1976 for ourconstructed open-end, "HIFO, 75%" fund. Can this strategy be maintained for even longerperiods? We believe tha

29 t it can. In fact, we believe that our "
t it can. In fact, we believe that our "HIFO, 75%" fund is in evenbetter shape than our "HIFO only" fund to continue its considerable benefits for taxableinvestors. At the end of 1991, the "HIFO, 75%" fund had 5.28 percent of total assets as capitalloss carryforwards while unrealized capital gains represented 30.49 percent of its assets. Whilethe unrealized capital gains component may seem high, this percentage has been fluctuatingbetween twenty and thirty-six percent for the previous twelve years. It is hard to imagine that22 this fund would be forced to make a realized capital gain distribution in the near futur&8. Our"HIFO only" SURGE fund is also in good shape to maintain high post-tax returns to itsinvestors, but it had just 0.83 percent in loss carryovers and, historically, has had troubleoffsetting gains when its portfolio contained more than thirty percent of unrealized gains. Theyear-end unrealized gain component for 1991 was 27.93 percent.Tables 4 and 5 clearly show the differences between closed-end and open-end fundsdiscussed earlier. The closed-end, "HIFO only" fund makes realized gains distributions in everyyear since 1980.While our booking losses strategy greatly improves the closed-endperformance, the strategy of realizing losses is not able to eliminate all gains distributions. Ineach year, the unrealized gain component is much higher for the closed-end fund than for itsopen-end variant, a fact which demonstrates the difficulty in reducing taxable distributions tosharehold

30 ers in closed-end funds. For our closed-
ers in closed-end funds. For our closed-end funds at the end of 1991, unrealizedcapital gains were 59.75 percent of total assets for the "HIFO only" variant and 63.50 percentfor the "HIFO, 75%" strategy. The corresponding open-end percentages were 27.93 and 30.49,respectively.Volatility within the index's constituents can be helpful for the 'HIFO, 75%" fund.Since the end of our analysis, for example, two major S&P 500 constituents, IBM in 1992 andApple Computer in 1993, have experienced share prices which have more than halved in arelatively short period of time. These sharp declines would result in large capital losses beingrealized by our "HIFO, 75%" fund since 1991.23 IV. Conclusions and ExtensionsWe have shown that simple tax management strategies could have improved after-taxperformance of equity index mutual funds without harming before-tax returns for the 1977-1991period. Our closed-end and open-end SURGE funds would make every investor at least as welloff as the equivalent fully replicated index funds while those investors subject to taxation ofdividend and realized capital gains distributions would unambiguously benefit. The additionalexpenses associated with the slightly higher turnover that result from these tax advantagedapproaches would be small relative to the increases generated in post-tax returns. We even findthat most of the tax benefits could be obtained solely through implementing HIFO accountingprocedures in the sale of securities. This "HIFO only" fund always maintain

31 s the true indexweights.The strategies u
s the true indexweights.The strategies used to reduce or eliminate realized capital gains are shown to be moreeffective for open-end funds than for closed-end investment companies. The main reason forthis result is, as security prices rise over time, the lack of substantial sales of new fund sharesin closed-end funds implies, on average, portfolios of closed-end funds will have lower basesthan their open-end equivalents. When HIFO procedures are implemented, therefore, open-endfunds will tend to realize fewer capital gains than closed-end funds. In addition, the higherbases of the open-end funds implies that when strategies are used to book large capital losses,open-end funds are more likely to have significant bundles of securities which can be sold at orbelow the loss realization trigger.24 This paper shows that tax management policies could be effective using only the underlyingsecurities in a fund which tracks the S&P 500.Thisis a very restrictive approach. First,actively managed funds which are not tied to any specific equity index should find it easier tosell loss positions and avoid tracking problems due to wash sale restrictions since securitysubstitutes are not restricted to a specific set of stocks. Second, there are many opportunitiesto use derivative securities to achieve realized capital gains reductions. The use of derivativesand straddle positions to offset realized capital gains has been discussed, for example, by Stiglitz(1983) and Constantinides and Scholes (1982).There a

32 re many other types of mutual funds whic
re many other types of mutual funds which could be created as SURGE funds.Consider a fund which invests in a well-diversified portfolio of non-dividend (or possibly verylow dividend) paying securities and also implements SURGE techniques. Such a fund wouldnever need to make any distributions to shareholders, and, therefore, all investments could growat the pre-tax return. This fund could provide a lower cost alternative to popular variableannuity investments since there is no need to achieve tax-deferred status by wrapping the fundin an insurance policy which requires expense and mortality fee payments. Furthermore, unlikevariable annuity products, there would be no penalty for withdrawing money before age 591/2.Finally, when money is withdrawn from the non-dividend SURGE fund, redemptions (above costbasis) would be taxed at the historically lower capital gains tax rate rather than at the incometax rate in the case of the annuity. The creation of a non-dividend SURGE fund is a subject ofour ongoing research.25 REFERENCESConstantinides, George M., 1983, Capital Market Equilibrium with Personal Tax,Econometrica51, 61 1-636.Constantinides,George M.,1984, Optimal Stock Trading with Personal Taxes: Implicationsfor Prices and Abnormal January Returns, Journal of Financial Economics 13,65-89.Constantinides,George M. and Myron S. Scholes, 1980, Optimal Liquidationof Assets in thePresence of Personal Tax, Journal of Finance 35,439-449.Commerce Clearing House, Inc., Capital Changes Reporter.Dammon,

33 Robert M., Kenneth B. Dunn, and Chester
Robert M., Kenneth B. Dunn, and Chester S. Spatt, 1989,A Reexamination of theValue of Tax Options, Review of Financial Studies 2, 341-372.Dickson, Joel M. and John B. Shoven, 1993, Ranking Mutual Funds on anAfter-Tax Basis,NBER Working Paper No. 4393.Huddart, Steven and V.G. Narayanan, 1993, Taxation andInstitutions' Trading Decisions,Stanford University, unpublished manuscript.Ibbotson and Associates, 1993, Stocks, Bonds, Bills, and Inflation (IbbotsonandAssociates, Chicago, IL).Jeffrey, Robert H. and Robert D. Amott, 1993, Is Your Alpha Big Enoughto Cover ItsTaxes?, Journal of Porzfolio Management, Spring, 15-25.Lee, Charles M.C., Andrei Schleifer, and Richard H. Thaler, 1990,Closed-End Mutual Funds,Journal of Economic Perspectives 4, Fall, 153-164.Stiglitz, Joseph E., 1983, Some Aspects of the Taxation of CapitalGains, Journal of PublicEconomics 21, 257-294. &#x/ref;&#x_sec;&#xtion; Table 1S&P 500 deletions(8/1/1976 -12/3111991)YearDeletionsPercent of Index197660.38%197780.30%1978130.33%1979140.85%1980161.14%1981213.12%1982282.31%1983191.86%1984314.33%1985284.98%1986303.34%1987262.62%1988252.67%1989294.24%1990131.09%1991100.68%Deletions are the total number of firms deleted from the S&P 500 index in the calendar year.Percent of index is the sum of the percentages of the S&P 500 that the firms accounted for atthe time of deletion. 1.89 13.63% 85.0 (1.70) (11.26%) 1.92 13.93% 86.4 (1.71) (11.27%) 1.92 13.96% 86.4 (1.70) (11.26%) 4.11 15.19% 75.5 (3.53) (13.43%) 4.35 15.84% 81.8 (3.57) (13

34 .58%) 4.37 15.89% 82.5 (3.57) (13.57%) 5
.58%) 4.37 15.89% 82.5 (3.57) (13.57%) 5.32 11.79% 39.2 (4.54) (10.62%) 5.81 12.45% 46.9 (4.72) (10.90%) 5.84 12.49% 46.9 (4.72) (10.90%) 1.88 13.43% 85.0 (1.69) (11.05%) 1.90 13.74% 85.7 (1.69) (11.08%) 1.91 13.77% 85.7 (1.69) (11.06%) 3.90 14.57% 77.6 (3.33) (12.79%) 4.20 15.43% 83.2 (3.44) (13. 16%) 4.23 15.51% 85.3 (3.45) (13.17%) 4.73 10.92% 41.5 (4.03) (9.74%) 5.35 11.84% 50,0 (4.33) (10.27%) 5.39 11.89% 50.0 (4.34) (10.28%) Table 2 Mutual Fund Management and Returns to Shareholders Vanguard Index 500 v. Open-End S&P 500 SURGE funds Fund Description Pre-Tax Returns Value Pct/year Rank Mid-Tax Returns Value Pct/year Rank High-Tax Returns Value Pct/year Rank Avg Turnover 1987-1991 Vanguard 500 SURGE HIFO only SURGE HIFO, 75% 1982-1991 Vanguard 500 SURGE HIFO only SURGE HIFO, 75% 1977-1991 Vanguard 500 SURGE HIFO only SURGE HIFO, 75% 2.01 15.01% 66.0 2.00 14.91% 64.6 2.00 14.89% 63.9 4.85 17.11% 69.2 4.83 17.06% 68.5 4.82 17.03% 68.5 6.97 13.82% 27.7 6.97 13.82% 27.7 6.96 13.81% 27.7 12.20% 6.93% 15.78% 18.60% 10.99% 17.57% 17.27% 12.70% 19.09% Table 2 (cont'd) "SURGE HIFO only" is a fund which, when forced to sell securities, sells the highest basis shares. "SURGE HIFO, 75%" is a fund which, in addition to the HIFO strategy, realizes losses if a security's market price is less than 75% of the basis of at least 5% of the shares held. Value is the final dollar value of a $1 investment at the beginning of the period. Pct/year is the annual percentage return over the horizon. Rank is the

35 percentile rank of the fund in the sampl
percentile rank of the fund in the sample of 147 equity mutual funds considered by Dickson and Shoven (1993). Avg Turnover is the average of the annual turnover rates over the period under consideration. Table 3 Mutual Fund Management and Returns to Shareholders Closed-End S&P 500 SURGE funds Fund Description Pre-Tax Value Returns Pct/year Mid-Tax Value Returns Pct/year High-T Value ax Returns Pctlyear Avg Turnover 1987-1991 . SURGEHIFOonIy 2.01 14.93% 1.88 (1.70) 13.48% (11.16%) 1.86 (1.68) 13.25% (10.93%) 4.83% SURGE HIFO, 75% 2.01 14.97% 1.89 (1.70) 13.62% (11.22%) 1.87 (1.69) 13.40% (11.00%) 7.20% 1982-1991 SURGE HIFO only 4.85 17. 10% 4.21 (3.55) 15.47% (13.49%) 4.04 (3.39) 14.97% (12.98%) 5.40% SURGE HIFO, 75% 4.86 17. 12% 4.29 (3.56) 15.67% (13.53%) 4.13 (3.42) 15.24% (13.08%) 7.94% 1977-1991 SURGEHIFOonIy 7.00 13.86% 5.57 (4.64) 12.13% (10.77%) 5.04 (4.19) 11.39% (10.03%) 4.32% SURGE HIFO, 75% 7.02 13.87% 5.68 (4.67) 12.28% (10.82%) 5.19 (4.25) 11.60% (10.12%) 9.39% "SURGE HIFO only" is a fund which, when forced to sell securities, sells the highest basis shares. "SURGE HIFO, 75%" is a fund which, in addition to the HIFO strategy, realizes losses if a security's market price is less than 75% of the basis of at least 5% of the shares held. Value is the final dollar value of a $1 investment at the beginning of the period. Pct/year is the annual percentage return over the horizon. Avg Turnover is the average of the annual turnover rates over the period under consideration. Table 4Op

36 en-End S&P 500 SURGE FundsAnnual Summary
en-End S&P 500 SURGE FundsAnnual Summary StatisticsTrading strategy: HIFO onlyUnrealizedLossGain(% Assets)Assets$MMTrading strategy: HIFO and realize losses at 75% of basisPre-TaxYear NAV ReturnT.O.Income KG(%)Assets$MMPre-TaxT.O.Year NAVReturnIncome KG(%)LossCarryover(% Assets)197610.414.58%0.050.001.270.021.825.7814.1219779.27-8.06%0.310.004.650.428.893.2621.0419789.435.96%0.390.008.751.427.616.0230.57197910.7418.15%0.400.0032.493.684.0313.4939.36198013.6232.04%0.570.0022.682.752.5131.0450.07198112.31-5.00%0.630.0012.052.734.1923.2048.26198214.3321.23%0.590.0014.362.801.8530.4760.94198316.9521.36%0.440.002.570.702.7219.05180.92198417.255.93%0.630.0810.600.004.1219.54240.74198521.7831.50%0.870.0434.660.001.0331.10341.89198624.5017.61%0.810.3013.000.001.9435.40434.65198724.914.76%0.760.0011.871.7410.8121.75771.52198827.9116.13%1.010.006.880.725.5222.761000.57198935.3031.16%0.970.335.590.003.2629.291740.03199033.02-3.41%1.080.009.471.707.2723.982122.85199142.0330.01%0.900.000.870.833.5227.934273.50LossCarryover(% Assets)UnrealizedLossGain(% Assets)197610.414.58%0.050.001.350.061.795.7814.1219779.29-7.82%0.310.0016.614.764.743.6321.0819789.455.90%0.390.0017.386.543.667.2630.60197910.7618.13%0.400.0035.536.362.5014.6839.39198013.6331.90%0.570.0025.565.101.4932.3250.05198112.31-5.02%0.630.0015.566.351.9524.5248.23198214.3521.34%0.590.0021.437.080.2633.1760.96198316.9621.30%0.440.004.822.841.8620.28180.86198417.335.85%0.630.0018.723.601.6821.04240.53198522.0131.54%0.780.0036.221.380.3632.64341.

37 73198625.0817.51%0.790.0015.630.470.8436
73198625.0817.51%0.790.0015.630.470.8436.67434.09198725.354.18%0.780.0037.4710.902.6823.29766.72198828.3816.03%1.030.008.647.801.3826.03994.25198936.2531.21%0.990.007.353.581.2831.961732.39199034.05-3.03%1.100.0022.119.171.2626.652124.19199143.3830. 12%0.930.003.335.280.9830.494278.56 Table 5Closed-End S&P 500 SURGE FundsAnnual Summary StatisticsTrading strategy: HIFO onlyLossUnrealizedPre-TaxT.O.CarryoverLossGainAssetsYear NAY ReturnIncome KG(%)(%Assets)(% Assets)$MM197610.394.75%0.080.001.630.002.185.9410.4819779.18-7.84%0.400.000.830.0112.533.919.6519789.275.94%0.450.001.410.0913.656.5310.23197910.4217.96%0.510.002.200.0011.1615.5612.06198013.1631.99%0.550.041.940.007.6830.9115.92198111.79-4.98%0.590.134.370.009.5522.9615.13198213.6421.30%0.610.053.240.004.8528.7618.35198315.8921.80%0.640.091.880.002.9035.8022.35198415.775.95%0.690.378.970.004.2737.4823.68198519.4731.37%0.720.528.950.002.5945.5931.11198621.7217.60%0.750.426.820.002.6848.9036.59198721.584.93%0.840.376.830.004.1847.5538.39198823.6715.94%0.930.426.460.002.5648.3644.51198929.37 31.15%1.030.646.660.001.7355.0558.37199027.34-3.33%0.950.102.510.004.4252.4156.43199134.5630.02%0.950.031.680.002.5459.7573.36Trading strategy: HIFO and realize losses at 75% of basisLossUnrealizedPre-TaxT.O.CarryoverLossGainAssetsYear NAY ReturnIncome KG (%)(% Assets)(% Assets)$MM197610.394.75%0.080.001.770.052.145.9410.4719779.19-7.67%0.400.00 22.817.765.304.599.6719789.285.89%0.460.0014.97:11.544.729.1410.24197910.4317.96%0.510.007.2810.893.7119.1

38 212.08198013.2231.88%0.540.008.619.721.6
212.08198013.2231.88%0.540.008.619.721.6935.0115.93198111.97-4.95%0.590.007.8510.132.0427.0015.14198213.9121.32%0.610.0011.0610.170:2135.8618.37198316.2921.78%0.650.002.337.930.3742.9922.37198416.565.99%0.700.0011.065.710.5843.4223.71198521.0331.38%0.730.009.921.890.2650.7431.15198623.9217.55%0.780.029.010.000.5353.3836.61198724.054.89%0.870.169.730.001.3252.1238.40198826.3315.89%1.030.527.580.000.7752.8444.51198932.7031.16%1.110.737.260.000.4858.6358.38199030.61-3.16%1.060.008.842.070.4855.9656.53199138.7630.09%1.060.002.591.700.3063.5073.54 Table 6Vanguard Index 500Annual Summary StatisticsPre-TaxAssetsYearNAVReturnIncomeKGTurnover$MM(%)197614.73N/A0.170.002.0014.33197713.01-7.840.570.006.0021.04197813.115.870.650.008.0066.15197914.6418.050.750.0629.0078.98198017.8431.920.840.5218.0098.74198115.52-5.210.830.5612.0091.24198217.5620.970.830.2511.00110.03198319.7021.290.880.7035.00233.66198419.526.210.970.3914.00289.70198522.9931.230.941.5836.00394.26198624.2718.060.921.9929.00485.10198724.654.700.690.1715.00826.29198827.1816.221.100.3210.001055.07198933.6431.361.200.758.001803.84199031.24-3.331.170.1023.002173.00199139.3230.221.150.125.004345.33Source: Morningstar, Inc. Figure 1A Pre-Tax Redundant Security+10% p+5% 1-pVS.+30% p-10% p+0.5-10% 1-p+20% 1-p0.5 a, 0 a, I— ci 1977 1978 1979 1980 1981 1982 1983 1984 1985 1986 1987 1988 1989 1990 1991 Year Figure 2 Annual Pro-Tax Total Return Comparisons Vanguard Index 500 v. Constructed Open-End S&P 500 Funds Vanguard 500 HiFOoffly I HIFO,seHat75