
under CCAP A feasibility study Mangesh Patankar Microinsurance Fellow at Philippines Crop Insurance Corporation AbbreviationsANTRECCOAgusan del Norte Teachers Retirees Communities CooperativeCARDCen ID: 838665
Download Pdf The PPT/PDF document "Weather index insurance" is the property of its rightful owner. Permission is granted to download and print the materials on this web site for personal, non-commercial use only, and to display it on your personal computer provided you do not modify the materials and that you retain all copyright notices contained in the materials. By downloading content from our website, you accept the terms of this agreement.


1 Weather index insurance under CCAP A
Weather index insurance under CCAP A feasibility study Mangesh Patankar, Microinsurance Fellow at Philippines Crop Insurance Corporation AbbreviationsANTRECCOAgusan del Norte Teachers Retirees Communities CooperativeCARDCentre for Agriculture and Rural DevelopmentCCAPClimate Change Adaptation ProjectCLIMBSCoop Life Insurance and Mutual Benefit ServicesDADepartment of AgricultureDOLEDepartment of Labour and EmploymentDTIDepartment of Trade and IndustriesEvapotranspirationFood and Agriculture OrganizationGSISGovernment Service Insurance SchemeGTZGerman Technical CorporationInsurance CommissionIGIDRIndira Gandhi Institute for Development ResearchILOInternational Labour OrganizationIFADInternational Fundfor Agricultural DevelopmentIFPRIInternational Food Policy Research InstituteLGULocal Government UnitMDGMillennium Development GoalFundNASANational Aeronautics and Space AdministrationNSONational Statistics OfficeOCDOffice of Civil DefenceOPVOpen Pollination VarietyOTOPOne Town One ProductPAGASAPhilippine Atmospheric, Geophysical and Astronomical Services AdministrationPagIBIGPagtutulungan sa Kinabukasan: kaw, angko, ndustria at obyernoPCICPhilippines Crop Insurance CorporationRTRRemedios T. RomualdezSocial Security SchemeUNUnited NationsVBARDVietnam Bank for Agriculture and Rural DevelopmentWFPWorld Food ProgrammeWIBIWeather index based insurance ContentsIntroduction1.1Objective1.2Methodology1.3Structure of the reportPlanned interventions under CCAP2.1Priority areas identified under CCAP2.2Concept of weather index insurance2.2.1Benefits2.2.2Ideal Index2.2.3ChallengesDescription ofthe Priority Areas3.1Demographics3.2Land profile3.3Weather3.4Livelihoods3.5Financial institutions3.6Risk faced by farmersState of current risk management solutions in the proposed region4.1Insurance4.1.1Life insurance4.1.2Agriculture insurance4.1.3Health Insurance4.2Pension and other socia
2 l security plans4.3Agriculture Guarantee
l security plans4.3Agriculture Guarantee Fund Pool (AGFP)4.4Contingency Funds4.5post techniques Product feasibility5.1Analysis of weather data availability and validity5.2Choosing among micro, meso and macro policies5.3Crops and crop parameters 5.3.1Rice5.3.2Corn5.3.3Reference Evapotranspiration5.3.4Crop coefficients and yield coefficients for corn and rice5.4Analysis of crop yield loss data availability and validity5.5Review of literature on schemes in similar areasMarket assessment6.1Client education6.2Capacity assessment of insurer and aggregators6.3Regulatory environmentRecommendations7.1Proposed nature of the contracts7.2Correlations with actual lossesError! Bookmark not defined.7.3Pilot areas7.4Feasibility of offering joint products7.5Phased approach7.6Incorporating Climate Change Scenarios from PAGASAReferencesAnnexure 1: Feasible areas that could be coveredAnnexure 2: CCAP priority municipality locationsAnnexure 3: Input costs and income for corn and riceAnnexure 4: Partners of ILO under CCAPAnnexure 5: Yield for Rice and Corn Agusan del NorteAnnexure 6: Major floods in Butuan CityAnnexure 7: Rice claims data for Agusan del Norte Introductionhis document discusses feasibility of implementingWeather Index Based Insurance (WIBI) pilot under Climate Change Adaptation Project (CCAP) in a select few sites in Agusan del Norte, a province of Caraga region on Mindanao islands of Philippines. CCAP is a part of a larger initiative named “Joint Programme on Strengthening the Philippines’ Institutional Capacity to Adapt toClimate Change” implemented jointly by United Nations with the Government of Philippines with support from Spanish government through the United Nation’sMDGAchievement Fund. CCAP is implemented by the International Labour Organization (ILO), a specialized agency of the United Nations together with the Department of Labor and Employme
3 nt (DOLE), Department of Trade and Indus, Department of Trade and Indus")
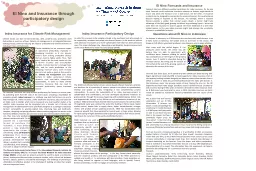
nt (DOLE), Department of Trade and Industry (DTI) and the Province of Agusan del Norte.Under this, Philippines Crop Insurance Company (PCIC) would underwrite innovative insurance products, based on weather index.ObjectiveThe objectives set forth before writing this report were as follows:Understand weather risks at various levels in the priority area ofCCAPUnderstand the availability of the data essential to create WIBI contracts at various levelsPropose best possible products in the current context and current season for areas of CCAPComment on the way forward for the next seasonsMethodologyMost of thisreport extensively relies on the work already done by the CCAP partners on the field. Apart from the references to the Vulnerability and Adaptation Assessment Report, Baseline Study Report and Value Chain Analysis Report, we have also used the following approaches to build the study:Interviews with Municipal Focal Teams of LGUs, and particularly Agriculture Officers of RTR and BuenavistaInteraction with Jeff Lawrence (Country Director of ILO) and Lurraine Villacorta (Project Manager of CCAP)Interactions with the management of Philippines Crop Insurance Corporation(PCIC), particularly Norman Cajucom (Senior Vice President), Carmen Hutaba (Vice President), Atty. Rosa Gatinao (Regional Manager for Region X), Roy Alamban (Acting Marketing Chief for Region X) and Romeo Salting (Regional Manager for Region IX)Interactions with the key partners of ILO under CCAP, namely Department of Trade and Industries, Department of Labour and Employment, Agusan del Norte Provincial GovernmentInteractions with Philippine Atmospheric, Geophysical and Astronomical Services AdministrationPAGASAofficers (Manila and Bancasi Airport Offices) and weather data collected from PAGASA and NASA (provided by the regional office of the Department of Agriculture)Interactions with FAO, Manila OfficeInter
4 views of corn and rice specialists from
views of corn and rice specialists from the Department of Agriculture, Caraga Region OfficeInteractions with officers of Office of Civil Defence(OCD), Caraga Region Interviews of officers of several cooperatives, banks and associations involved in agriculture lending in Caraga region like People’s Bank of Caraga, ANTRECCO, CARD Inc, Enterprise Bank, FICCO, Surigaonon Rural Banking Corporation and Land BankInteractions with Prof. Daniel OsgoodInteractions with individual farmers from the four priority municipalities(Columbia University), Prof Travis Lybbert (University of California, DavisCampus), Ruth Hill (IFPRI), Gabriele Ramm (GTZ), Francesco Rispoli (IFAD), Niels Balzer (WFP),Alok Shukla (TATA AIG General Insurance Company) and Sarthak Gaurav (IGIDRStructure of the reportChapter 2 discusses about the planned interventions under CCAP and particularly about WIBI. Chapter 3 describes risk profile of the residents in the priority area of CCAP and in a way summarizes the WIBI development related findings of Vulnerability and Adaptation AssessmentStudycarried out under CCAP. Chapter 4 lists various risk management techniques adapted by the people of the concerned area whereas Chapter 5 discusses technical aspects of designing possible WIBI products. An assessment of capacity of the insurance supply chain players and regulations is carried out in Chapter 6 whereas Chapter 7 concludes the document with the specific recommendations.Planned interventions under CCAPIn the context of increasing worldwide discussions on the hazards of climate change particularly affecting the agrarian population of poorer nations, it becomes essential to look into the possible ways of integrating risk management mechanisms into the current financial systems. UNFCCC (2007) specifically emphasizes the need of having a sound adaptation strategy and involving risk sharing and risk transfer m
5 echanisms like insurance. Weather indexb
echanisms like insurance. Weather indexbasedinsurance(WIBI)or climate insurance could be one of such efforts in this direction. WIBI is a recent innovation in the agricultural risk management sector and is believed to address many of the issues faced by the existing indemnity based insurance schemes and area yield index insurance schemes Prof. Osgood is the official mentor appointed by ILO’s Microinsurance Innovation Facility for the Microinsurance Fellow for this project.Hellmuth, M. E., et al., 2009, 'Index Insurance and Climate Risk: Prospects for Development and Disaster Management', International Research Institute for Climate and Society, Columbia UniversityThe mostdistinct feature of weather index insurance is the simplicity of the process of claim estimation as the insurance payouts do not depend on the manual field loss assessments but rather on the preagreed index triggers. esigning of such insurance incorporates analysis of the historical weather information unlike the design of traditional crop insurance where focus is on historical losses.Within the duration of three years (2009 to 2011),CCAP willdevelop and test several financial safety nets in the selected priority areas of province of Agusan del Norte. The products include credit for certain microenterprises and WIBI. A flow diagram of planned interventions under CCAP could be found in Figure 1We hope that the document ould serve as a guide for theproduct designers and implementers involved in this initiativeto develop and scale up WIBI schemes in Agusan del Norte province of Philippines. Priority areas identified under CCAPAfter conducting a baseline study in all of the municipalities of Agusan del Norte, ILO along with its partners selected four municipalities as the priority areas for intervention. These are namely Buenavista, Jabonga, Las Nieves and
6 Remedios T. Romualdez (RTR). The financi. The financi")
Remedios T. Romualdez (RTR). The financial schemes are envisaged to be launched in these municipal areasThe feasibility study is hence applicable only to these four municipalities. A brief geographical profile of these municipalities is given in AnnexureConcept of weather index insuranceWeather index insurance, in true sense, is a ‘bet’ on the indexformed from weather parameters, modified to help the insured customers. In fact some contend that it is actually a derivative, with weather index as the underlying entity. To work as insurance, the index of this derivative should reflect actual losses of the insured. It is observed that bad weather usually causes decrease in the production which results in loss of income for the farmers. A weather index designed in such a way that it highly correlates with the production losses could be used as an underlying for the derivatives. One of the market players for such derivatives could be farmers whereas the other party could be insurer. The farmers could receive payouts from the insurer when the index indicates bad weather for crops from such derivatives. It should be noted that in such case, the payout of the derivative would solely depend on the weather index and not on the actual assessment of the farmer’s losses on the field.Figure : Planned interventions under CCAP Source: ILO CCAP planning documents 2.2.1BenefitsThere could be many benefits of such insurance schemeover the traditional insurance. In the traditional crop insurance, crop losses are measured by manual assessment procedures. This needs the insurance professionals to physically visit the insured farm. Moreover it also indicates high dependence on manual judgment of losses unless a robust crop loss measurement procedure is in practice. The insured farmer might also decide not tolook after the crops, which creates the problem of moral hazard. Fur
7 ther, if the insurer does not exclude th
ther, if the insurer does not exclude the high risk areas, farmers from such areas would tend to buy the insurance regularly and would receive payouts in almost all the seasons2.2.2Ideal Index. The index insurance approach addresses many of these challenges. As the payout is dependent on the weather parameters measured by a third party, there is little scope of the judgmental errorsfrom the insurer. This also makes WIBI more attractive than the traditional schemes for reinsurers, which decreases the burden on the insurer to diversify the risk internallyDue to reduced burden on the human resources and due to higher reinsurance availability, the insurer can quickly increase their portfolio to cover more and more farms. Further, the simplicity of measuring losses directly reflects into reduced claim settlement time.Moreover, if the parameters are made publicly available, the farmers themselves could calculate the expected claims at the end of the insurance period and thus could reduce potential disputes on the size of the claim between the farmers and the insurer. As claims are systemic in nature, all the farmers in a particular area availing a certain policy would receive same payouts. This clearly decreases the possibility of adverse selection mentioned earlier.As a thumb rule, an ideal index for WIBI should possess the following properties:It should be a good proxy for lossesDataforbuilding theindex should be easy to obtainData for index should be from reliable sourcesData for index should have historical presence2.2.3ChallengesThe benefits mentioned above do not indicate that WIBI is a panacea of all the problems faced by crop insurers. Basis risk is a key challenge faced by insurers while implementing WIBI, particularly in the developing countries. The word basis risk is related to the risk of paying out inaccurate claims. As mentioned earlier, WIBI claims are sole
8 ly dependent on weather parameters measu
ly dependent on weather parameters measured by a third party. If the weather index of WIBI is poorly built, it might not correlate well with the crop losses. Further, if the weather experienced by the farm is different than the weather experienced at the location where the measurement instrument is installed, it might reflect erroneous claim values. The first problem could be solved by using complex models. However there is always a tradeoff between the complexity and comprehensibility of the product, as most of WIBI schemes are directed towards farmers who might not be highly educated. The second problem could be solved by having dense network of weather measurement instrument in the sales area of insurance. However this might not be affordable for a single insurer and thus donor support could be required. One more way to handlebasis risk is to design This issue is known as adverse selection in insurance terms. insurance products based on vegetative index or any other alternative indices, which are better predictors of the losses. However, insurance schemes based on such indices are yet to see scaled markets dueto high capital costs associated with their designing.We have tried to take into consideration most of these challenges before making definite recommendations in this report.Description of the Priority AreasBefore discussing about the feasibility of designing specific index products for the areas under CCAP, it would be essential to first understand in detail about the terrain,livelihoodsand key risksin the priority areasDemographicsWhereas most of the population of Buenavista stays in urban settlements, most populationof Las Nieves stays in rural areas. Still, due to the large geographic area available, highest number of families dependent on farming in Buenavista. Municipality/City Rural population Urban popul
9 ation Number Of Families Dependent O
ation Number Of Families Dependent On Farming Buenavista 36023 17036 4,768 Jabonga 19414 3638 3,527 Las Nieves 23961 1241 3,669 RTR 10494 4482 1,946 Source: SocioEconomic ProfileAdN(2005)and NSO (2007)Land profileTotal land area covered by each municipality is given below:MunicipalityArea (hectares)Area under agriculture (hectares)% area under agricultureAgricultural Soil Types Buenavista 47,561 9,175.30 19.29 Camansa Clay Loam, San Miguel Clay Loam, Isabela Loam/Buguey Loamy Sand Jabonga29,3009,58932.73Kicharao silt loam, clay loam Las Nieves 58,269 7,833.84 13.44 Camansa Clay Loam, San Manuel Clay Loam RTR7,9154,94562.48 Butuan/San Miguel Loam, Malalag Silt Loam, Mountain Soil(Rubble Land) Source: Provincial Planning and Development Office, Agusan del Norte (2009)We can clearly see that agricultural area in Las Nieves is smallest in proportion, due to large forest lands. Same holds true for Buenavista where agriculture is concentrated in low lying areas. In RTR too, agriculture is concentrated in low lying areas, but land available for agriculture is greater in proportion. Naturally percapita land available is higher in RTR than any other municipality and income from farming per household seems higher.The municipalities have access to different water resources. A municipality wise summary is given below: MunicipalityWater Resource BuenavistaCabalalahan River, Gihaoan River, and Kiagta River JabongaBaleguian River and Calinawan River, Lake Mainit RTRCabadbaran Rive Las Nieves Magos River, Katipunan River, Marcos Calo River and Lingayao River Source: Compiled from Baseline Study, ILO CCAPWeatherPAGASA has divided Philippines into four distinct climate zonesLivelihoods. Accordingly, all the four municipalities exhibit Type 4climate, characterized by no distinct dry season. he period from March to Augus
10 t is called as ‘wet season’ wh
t is called as ‘wet season’ whereas September to February is known as ‘very wet season’.The municipality of Jabongais situated almost on the border of the Type 4 and Type 2 weather zones. Type 2 weather zone is characterized by ‘no dry season with very prominent rainfall between December and February’.Due to prominent rainfall in the ‘very wet season’, there have been several historical instances of floodingparticularly inthe months ofJanuary and February.Except Jabonga, no other municipality is in typhoon belt. However all themunicipalities receive heavy rainfall in case of occurrence of typhoons in the nearbyareas.Jabonga, on the other hand, has experienced five supertyphoons in the years between 1964 and 1994. It is exposed to seven percent of the typhoons hitting the country. Most of the population in rural barangaysinvolved in agriculture. Rearing livestock, fisheriesand running sarisari store Municipality are popular supplementary sources of livelihood. Key crops taken in the priority areas are shown below: Major crops Buenavista R ice, coconut, banana and corn with some vegetable and root - crops RTR Rice, coconut, banana Jabonga Rice , c oconut , b anana , c orn , s quash Las Nieves Rice, corn, coconut, banana, coffee Source: Compiled from Value Chain Analysis and Baseline Study of ILO CCAPCropping seasons of the major cereal crops like rice and corn are somewhat synchronizedwith wet and very wet climatic seasons. Rice is grown in the windows of May to September and November to March whereas corn is grown from January to May and July to November.Though a detailed data on the share of each source of income source is not available, it could safely be assumed that the income is well diversified in case of most of the farmers. 4 http://kidlat.pagasa.dost.gov.p
11 h/cab/climate.htm Barangay is a local Fi
h/cab/climate.htm Barangay is a local Filipino term for ‘village’. In the administrative hierarchy, several Barangays make up a municipality or a city. Several municipalities make a province whereas several provinces make a region.Mainly swine and poultry farming. A few people are also involved in raising carabao/other cattle, duck farming, goat and sheep farming etc.Petty shop Financial institutionsWhile assessing the feasibility of introducing innovativefinancingproducts under CCAPneed was felt to locate best possible intermediaries having a prior experience of offering financial services.Hence a brief profiling study of the key financial institutions was carried out by DTI(focusing on lending institutions) and DOLE (focusing on insurance schemes)assisted by the Microinsurance Fellow. We shall brieflydiscuss the findings of the study here.Most of the farmers in the CCAP area are dependent on individual agriculture traders for supply chain support. These traders, apart from buying the agricultural produce from the farmers, give informal credit to take care of the expenses on agriinputs. Typically the interest rates for these loans are much higher than the formal loans. On the formal credit providers’ front, though there are banks, cooperatives and NGOs existingin the province, very few have interactions with the farmers in the priority municipalities. Interestingly, as per our discussions with Land Bank, which is a specialized government bank specifically incorporated to focus on agriculture lending, it does not have any tieup with any lender having existing retail (individual) agriculture loan portfolio in any of the priority areas. That leftus focusing on cooperatives and banks whichare not muchdependent on Land Bank for provision of credit. People’s Bank of Caraga, CARD Inc, Enterprise Bank and BAUG Cooperative were found to be activelenders i
12 n the priority areas.In the context of a
n the priority areas.In the context of agriculture lending by nonbanking institutions, the case of agrifinancing by LGU of RTR is worth mentioning. Under the nationwide One Town One Product (OTOP) Programme, LGU of RTR has focused and promoted production of organic ricesince 2005For this, the LGU supports organic rice farmers with loans bundled with life and crop insurance underwritten by PCIC. A distinct feature of these loans is that they are collateral free and in case of defaults, all other farmers in the same barangay are refused loans in the next agricultural season. This creates an immense social pressure on the farmers to repay the loans. Till date, there have been no cases of defaults under this scheme.On macrolevel, the municipalities receive credit from Land Bank (and any other sources) for infrastructure development. Riskfaced by farmersRisks faced by farmers could be divided in two parts:Production risksThe Vulnerability and Adaptation Assessment Report describes theagricultural production risks of priority areasin detail.We will try to summarize its findings in this subsection.BuenavistaLas NievesRTRJabonga Typhoon 2009 1964, 1984, 1985, 1993, 1994 Flood 2003, 2005, 2006, 2007, 2008, 2009 1999, 2002, 2006, 2008, 2009 2003, 2005, 2006, 2007, 2009 1980, 1985, 1986, 1993, 1996, 2006, 2008 Drought 2003, 2004, 2005, 2006, 2009 2002, 2003, 2009 Does not affect much. Most of the 1983 area is irrigated. Earthquake1978 Due to availability of sufficient irrigation supply, RTR is not affected by droughts, but many of its barangays are affected during floods. The records above also give a picture about availability of data on past calamities. Whereas in case of Jabonga, a very long series of data is available, the same is not true for other municipalities.Apart from these pest attacks and crop diseases arealso prevalent, particula
13 rly in RTR and Buenavista, causing produ
rly in RTR and Buenavista, causing production losses though the government arranges several training programmes to make farmers aware about pest management.Continuous rainfall sometimes leads to water logging and spread of diseases, which affect livestock productivity.Price riskThe table below shows post harvest facilities available in the priority areas. Interestingly, RTR and Jabonga whichhave easy access to the national highway, lack substantially in basic output processing facilities. The functioning of agricultural cooperatives or organized granaries is very limited in all the four municipalities and virtually no procurementoccurs through them. Naturally, farmers rely on individual private traders to sell their outputs in unprocessedform, who end up making 50 to 100 percent profit in trading.As mentioned above, apart from procuring the produce, these tradersalso provide informal loans to farmers and thus in a way cover entire supply chain.MunicipalityTypes of Facilities Threshing / ShellingDryingMillingWarehouse / StorageTotal Buenavista 49 29 13 11 102 Jabonga Las Nieves R.T. Romualdes Source: Post Harvest Facilities Development Plan 2006State of current risk management solutions in the proposed regionIn this chapter, e will take a look at the availableinsurance services and other risk management practicesin the priority areas.Insurance4.1.1Life insuranceLife insurance schemes are mostly tied up with formal loans. Notable underwriters include PCIC, CLIMBS, Pioneer Lifeand CARDMBA etc. Informal insurance schemes covering funeral expenses through barangay level societies are popular, particularly in Las Nieves.Standalone life insurance products have very low penetration in the area. 4.1.2Agriculture insuranceExcept for RTR, where the LGU programme gives insured loans for agriculture, PCIC does not have much presence in the priority municipalities Bor
14 rowing farmer This could probably be a
rowing farmer This could probably be attributedto theabsence of existence of credible distribution mechanism.In the case of Jabonga and Buenavista, PCIC has tied up with the municipal livestock ispersal programmeto offer livestock insurance to the farmersAs the feasibility study is specifically focused on agriculture insurance products, we will discuss the prevalent insurance rates in the region. Multi risk coverNatural disaster cover PalayCorn PalayCorn WetDryPhase Phase B WetDryPhase APhase B Farmer 5.97 4.35 4.37 9.25 Farmer 2.5 2.03 2.92 7.72 2.341.72.074.381.671.351.213.2 Govt 7.95 5.79 5.96 12.61 Govt 3.91 1.35 3.93 10.4 Total16.2611.8412.426.24Total8.084.738.0621.32 Self financefarmers Multi risk cover Natural disaster cover PalayCorn PalayCorn WetDryPhase APhase B WetDryPhase APhase Farmer8.316.056.4413.63Farmer4.173.384.1310.92 Govt.7.955.795.9612.61Govt.3.913.173.9310.4 Total16.2611.8412.426.24Total8.086.558.0621.32 We can see that total premium goes as high as 26.24 percent in case of Phase B of corn crop, which indicates full payouts in one out of four years. On the other hand, natural disaster cover for Palay is charged at only 8.08 percent, which indicates full payouts in one out of twelve seasons (considering no payouts in other seasons).One more point to be noted is that the lending institution shares some portion of the premium in case of loanlinked insurance, rather than receiving any agency fees. This makes sure that the lender pays for the indirect benefits arising from reduced bad debt in case of crop failure. 4.1.3Health InsuranceIn terms of penetration, Philhealth It must be noted that agriculture insurance in Philippines is currently being underwritten only by PCIC.Phase A indicates crop in the first
15 semester (January to May) whereas Phase whereas Phase")
semester (January to May) whereas Phase B indicates crop in the second semester (July to November).Philhealth stands for Philippines Health Insurance Corporation. It is Philippine Government’s flagship insurance programme and is operated at national level.clearly stands out among all the insurance products. The growth of the outreach could bejudged from the graph below. Source: Local PhilHealth OfficePensionand other social security plansSocial security schemes like PagIBIG, GSISand SSS PagIBIG stands for Pagtutulungan sa Kinabukasan: kaw, angko, ndustria at obyerno. It is a national level savings programme targeted towards informal sector, with an objective to provide affordable housing to them.GSIS stands for Government Service Insurance Scheme. It is a pension fund for the government employees.too have some presence, though clearly not as much as Philhealth. All these three schemes havedifferent objective. PagIBIG offers a facility of long term savings and also allows the members to avail housing related facilities. GSIS can cover only government employees whereas SSS can cover private sector employees. SSS stands for Social Security Scheme. In simple words, this could be thought of as a counterpart of GSIS, but targeted specifically towards private sector. 1000200030004000500060001998199920002001 2002 2003 2004 2005 2006 2007 2008 2009 2010 Number of policiesYearPhilHealth Buenavista Jabonga Las Nieves RTR BuenavistaRTRJabongaLas NievesCurrent Penetration of PagIBIG Agriculture Guarantee FundPool (AGFP)Chiefly contributed by Land Bank and other government agencies, AGFP is created to provide guarantee to unsecured agricultural loans to smaller farmers in Philippines. The pool is envisaged to encourage credit institutions to increase lending to these farmers in the future. Though the pool does not give any direct ben
16 efits to the farmers (unlike agriculture
efits to the farmers (unlike agriculture insurance), it helps reducing the burden on the lending institutions in bad years. However, it should be noted that AGFP compensates the losses or defaults recorded by the lending institutions in short term, but expects them to ‘repay’ the compensation in the end. Further, bad debt due to any possible reason is eligible for the compensation, unlike insurance claims, where only definite perils mentioned in the policy are liable to claims.Contingency FundsFrom the meetings with the municipality officials, it understood that each municipality is mandated to keep aside five percent of its estimated revenue as annual lump sum appropriations for relief, rehabilitation, reconstruction and other works or services in connection with calamities which may occur during the budget year.post techniquesFurther the law also states that:“The calamity fund may also be utilized for undertaking disaster preparedness activities and measures, provided that the sanggunian concerned shall declare an imminent danger of the calamity”.And,“Any unexpected balance of the calamity fund at the end of the current year shall revert to the unappropriated Surplus for reappropriation during the succeeding budget year”.Thus it is clear that there is adefinitelegal provision to ensure partial allocation of annual fund at municipality level for calamity contingency.From baseline survey, it can be concluded that thoughsome forms of formal insurance packages are available in the priority area, their purchase is constrained by liquidity, thus affecting penetration of most of the insurance productsFurther, it is also clear that few farmers resort to informal exante rismanagement mechanisms like diversification of income sources, growing calamity resistant crop varieties etc.to manage agricultural risks. However, most of the farmers rely on
17 expost mechanisms to manage their farm
expost mechanisms to manage their farm risks. The key strategies include:Accessing distress loansShifting to labour employment or any other semiskilled/unskilled jobs like carpentry, peddling etc.Product feasibilityAvailability of long term and high resolution weather data, yield data and building dependable distribution process are some of the key factors to be able to implement WIBI successfully in the given region. Apart from this, insurance regulations, knowledgeof insurance among end customers and capacity of intermediaries and insurer could also play critical role.We will discuss about all these aspects in this chaer. Section 324 (d) of Republic Act No. 7160 Analysis of weather data availability and validityThe picture in Annexure 1 shows the onlysynoptic weather station available in the project area to date. weather station is situated at Butuan Bancasi Airportand is maintained by PAGASA. Thirty year historical data (starting 1981) from this weather station has been obtained by CCAP.A quicanalysis shows that among the total 10835daysrainfall data is unavailable for 875 days (or 8.075 percent values are missing). Particularly, since 2001, 247 values are missing. Apart from the synoptic station, there is one weather station installed in the campus of PhilRice, in RTR. There are also a few raingauges available in some of the municipalities. However data from these sources is not readily available.The circle shown in the picture shows the area covered within a radius of 20 km around this station (approximately). We see that municipalities of RTR and Buenavista are partially covered in this circle. However Jabonga and Las Nieves are quite far from the station, necessitating installation of weather stations if WIBI is pursued. To this end, CCAP took it upon itself to access support from the Department of Science and Techno
18 logy Caraga Regional Office for the inst
logy Caraga Regional Office for the installation of the needed weather stations under their collaboration for the establishment of Early Warning Systems in these area)The instruments shall be installed in 2011.Thus, it is clear that the WIBI products in CCAP can’t be launched in all the municipalities initially. Instead, a phased approach would be advisable, with the first phase in Buenavista and RTR, and possibly a secondphase product in Jabonga and Las Nieves. Weather data can be collected in Jabonga and Las Nieves, from newlyinstalled weather stations by DOST during the MayNovember 2011 cropping period which can support possible development of a similar product in the second phase.The table below captures the exact nature of the instruments. Municipality Current infrastructure Planned infrastructure in 2011 RTR Few rain gauges. Synoptic weather station at Butuan Airport Manual rain gauges, weather station and water gauges Buenavista Fewrain gauges. Synoptic weather station at Butuan airportWater gauge, manual and digital rain gauges Jabonga Few rain gauges. No synoptic weather station available in nearby area (20 km range) Water gauge, manual and digital rain gauges Las Nieves Few rain gauges . No synoptic weather station available in nearby area (20 km range) Water gauge, manual and digital rain gauges Regional office of DA also made available spatially interpolated rainfall estimation data from NASA for all four municipalities. However this data is available from 1997. We tried to use correlation analysis to understand the feasibility of using this data for filling up missing data valuesof Butuan weather stationthroughinverse distance method.Table below shows the correlation of dekadal rainfall among three data sets: spatial NASA rainfall data of RTR, spatial NASA rainfall data of Buenavista and pointbased (ground weather station ba
19 sed) rainfall data of Butuan AirportDek rainfall
data of Butuan AirportDek")
sed) rainfall data of Butuan AirportDekadal Analysis. We see that though Buenavista and RTR data has high correlation between themselves (perhaps due to same source), same does not hold true for correlation with Butuan data. Still, significant positive correlation is visible.Sum of Spatial RTRSum of Spatial BuenavistaSum of Actual Butuan Sum of Spatial RTR 1 Sum of Spatial Buena Vista0.795588008 Sum of Actual Butuan 0.187132391 0.229652405 1 The correlation becomes slightly better in case of monthly analysis.Monthly AnalysisSum of Spatial RTRSum of Spatial BuenavistaSum of Actual Butuan Sum of Spatial RTR 1 Sum of Spatial Buena Vista0.808791247 Sum of Actual Butuan 0.216504347 0.307464382 1 Considering the correlations above, we have filled up the missing data values from the available spatial rainfall data of RTR and Buenavista, using inverse distance method.Choosing among micro, meso and macro policiesThere could be three different levels at which WIBI contracts could be designed. For simplicity, we will call them micro, meso and macro level products. Level Insurable UnitProsCons MicroFarmers Highest level of accountability at bottom level. Direct impact.Efforts in education, Higher basis risk, Complex crop modeling Mesoggregators/mediators like banks Low basis risk. Indirecttrickledown effectEncourages business continuation.Easier to train.Absence of such organizations in most Barangays . Trickle down is not always ensured.MacroMunicipalities Low basis riskBest possible distributionEasier to trainChallenge of estimating loss dataPossible misuse of payouts Only Buenavista and RTR datasets are used as these municipalities are nearest to the synoptic weather station of Butuan City.Though Farmers Associations and Irrigators Associations are present,apparently they are not strong enough
20 to act as distribution agents. All the
to act as distribution agents. All the possibilities were discussed with the implementing partners of CCAP and the insurer thoroughly. While macro level cover looks interesting, it is currently not possible for PCIC to insure such entity, as its charter compels it to underwrite exclusively agricultural risks. In case such entities are insured, the use of claim amount would be a matter of their own discretion and most of the municipalities would end up using this money in relief and rehabilitation work, not exclusively focusing on agricultural sector. This would be against the PCIC’s charter. Nonetheless such insurance designing is quite possiblein case any other insurer is willing to underwrite such risk. In fact, as described already, each municipality has a definite provision of putting aside contingent funds from the budget every yearand partial if not all of such funds could be used to pay the premiums to the insurer, rather than selfinsuring the future risks. Though such insurance has been tried successfully at multinationlevel by Caribbean countriesCrops and crop parametersany instance of such arrangement at municipal level is unknown.Given the constraint of PCIC to underwrite purely agricultural risks, and given that no notable mesolevel partners could be found(except for the RTR LGU’s OTOP Programme)we conclude that only micro level index insurance would be possible currentlyThese insurance schemes would be crop specific and hence would involve indepth study of crop risks.t is not easy to cover all the cropsmentioned earlierin the priority municipalities under WIBI.Particularly, estimating yield loss for perennial crops due to poor weather is difficult. In case of irrigated crops, defining water stress remains challenge. After analyzing various crops taken in the priority area, we found it feasible to focus on rice and corn for WIBI. We tried to un
21 derstand the croppingpatterns of both of
derstand the croppingpatterns of both of thesein detail.5.3.1RiceMajority of the rice production in Philippines is taken in two seasons:Wet season: from March to SeptemberDry season: from September to MarchBut in case of Agusan del Norte, the seasons exactly reverse, due to pronounced rainfall in the months of December, January and February. The cropping seasons for rice here are:Wet season: from March to SeptemberVery wet season: from September to MarchAs stated before, due to very wet season in these two of the months, flooding is a major concern. Thus some municipalities arepromoting submerged rice varietiesto cope up with water inundationEarly, medium as well as late maturity varieties are sown in all the municipalities, but the most popular is medium maturity variety, with total cropping cycle of 115 to 120 days. Cropping calendars of all the four municipalities do not perfectly overlap. In RTR and Buenavista, second season is from later part of October or early November toMaywhereas in Las Nieves and Jabonga, ricesowing startsin the later The arrangement is known as Caribbean Catastrophe Risk Insurance Facility (CCRIF) and insures earthquakes and hurricanes. part of December andis harvested inMay.Further, across municipalities, irrigation status varies. An approximate picture is given in the table below:MunicipalityIrrigation Las NievesRain fed RTR Mostly irrigated Buenavista Rain fed as well as irrigated Jabonga Rain fed as well as irrigated The table below describes various phases of rice crop and key risks faced: PhaseEarly MaturityLate MaturityRisk faced Pre planting VegetativeCD, E Reproductive stage 30 30 CD, CR MaturityER, CR Total135155 Note: CD = Continuous dry days, ER = Excess rainfall, CR = Continuous rainy days5.3.2CornThere are chiefly two varieties of corn grown in the priority area
22 : White corn and Yellowcorn. Indigenous,
: White corn and Yellowcorn. Indigenous, OPV and hybrid types of seeds are available for white corn whereas only hybrid and indigenous seeds are available for yellow corn. Approximate ratioof land under non hybrid types to hybrid types is 2:1. OPV and indigenous crops have shorter roots and are known to be less tolerant to weather shocks as compared to hybrid.Municipality wise distribution of these varieties in CCAP priority area is given below:MunicipalityVariety BuenavistaWhite corn. Usually OPV. Las NievesYellow corn. Usually hybrid RTR White corn. Usually OPV. Jabonga White corn. OPV as well as Hybrid. As described earlier, there are two seasons in which the crop is grown: Semester 1 and Semester 2. Corn in semester 1 is grown in January/February and is harvested by June whereas semester 2 starts in July/August and ends by November. Most of the corn is rainfed and thus the sowing depends on onset of rainy period. A dekadal rainfall of 35 mm to 45 mm is necessary to start sowing. Though most of the times there is sufficient rain in the beginning of Semester 1, this factor becomes crucial in the Second semester, as July and August are relativelydry months. If there are no rains by August end, farmers might have to skip the whole cropping periodto avoid heavy rains during harvesting, which could occur in December (if the crops are sown after late August).Table below explains variousphases of crop development, the number of days associated with each phaseand key risks faced by the crop in those phases Broad phase Stage Number of days Key risks faced Semester 1 Semester 2 Semester 1 Semester 2 Planting and establishment Germination Leaf development VegetativeStem elongation Flowering Inflorescence emerging, heading Flowering, anthesis Maturity Development of fruit 15 15 - ER Ripening 30 30 - ER Total100107110 = Low rainfExcessi
23 ve rainfallSemester 1 has more rainfall
ve rainfallSemester 1 has more rainfall in the planting phase which causes faster growth of the crop in the first phase as compared to the growth in Semester 2.5.3.3Reference EvapotranspirationUnfortunately, reference evapotranspiration values were not available for local conditions. Hence ased on historical temperature and humidity data, we tried tofind average evapotranspiration values for the areas surrounding Butuan City Airport. The table below shows these values produced from ET Calculator of FAO. The values hold good for dekads starting with the shown dates, and thus have unit as mm per dekad or mm per ten days.Dekad start date 1 - Jan 2 - Jan 3 - Jan 1 - Jul 2 - Jul 3 - Jul Reference ET 33.133.945.246.1 Dekadstart dateFebFebFebAugAugAug Reference ET 36.238.641.346.546.747.9 Dekad start dateMarMarMarSepSepSep Reference ET 42.2 44.6 46.2 46.6 46.7 45.7 Dekad start dateAprAprApr Reference ET 48.8 49.6 49.7 44.2 42.5 42.1 Dekad start date MayMayMayNovNovNov Reference ET48.748.148.239.937.436.3 Dekad start date JunJunJunDecDecDec Reference ET47.745.244.735.334.134.4 5.3.4Crop coefficients and yield coefficients for corn and riceCrop coefficients (Kc) and yield factor (Ky) values were taken as per thestandard FAO guidelines. Kc valueswere adjusted for humidity and wind speed values noted at Butuan Airport. values for rice and corn are as follows:PhaseKc for riceKy for riceKc for cornKy for corn Sowing1.050.350.40 Vegetative1.051.090.7250.40 Reproductive1.051.091.0751.3 Maturity1.090.80.5 It should be noted that all these parameters are applicable for drought insurance. For excess insurance policies, local knowledge was used to develop loss parameters.Analysis of crop yieldlossdata availability and validityTo test the index, it is essential to know crop losses due to different perils in the past years. If such data is a
24 vailable, it could be viewed as against
vailable, it could be viewed as against the theoretical yield loss obtained from weather index based crop models to see if their values are similar. If a good match is obtained, one can safely conclude that the developed index is a good proxy for yield loss. There could be two different reasons if a good match is not seen: either the real yield data might have errors, or the model itself needs to be modified. However to analyze this, a sufficiently long yield data and weather data must be present. Further, it should be noted that yield data must be of same resolution as the weather data. In most of the cases, this would mean that the yield data should be obtained from the locations nearby the weather statioUnfortunately municipality wise and season wise disaggregated data is available for only past five years in the priority areasand that too for only a few municipalities . Seventeenyears (from 199) of yield data is available at province level from the regional office of Bureau of Agriculture Statistics.This is provided in the Annexure.We also tried to refer to the records of PCIC. However, seasonal disaggregated data could not be foundat the provincial levelThe data is divided as flood losses, rought losses, pest and disease losses, which might give some idea about payouts in the wet season due to drought and in the verywet season due to floods. Flood/Typhoon Drought Pests Diseases 20011218.433682.8972345.2292241.606 20021289.614371.5432174.3071632.067 20031830.7833480.8642489.533461.5401 2004 2005 20062476.481 2440.2332352 2007 2148.966 1611.838 1960.941 20083008.045 1496.8041333.9 2009 2796.542 3324.462 2033.41 1780.319 Average2109.8373714.9412084.4791680.339 The individual municipalitywise yield data is captured in the Vulnerability and Adaptation Assessment reports.
25 We clearly see that though per hectare p
We clearly see that though per hectare payments of drought have highest value, the payouts for other risks such as flood, pests and diseases can’t be ignored. Discussions with the local agriculturists also stressed that rather than drought in the months ofJuly to September, most of the priority areas are more vulnerable to floods in December to February. In RTR, most of the palay is vulnerable to pests and diseases, and in particular stemborer attack.Due to irrigated agriculture, farmers from RTR do not face drought risk much, unlike the farmers in Buenavista where a mixture of both irrigated as well as rain fed crops is found.The analysis abovesuggests that the availability of granular dataat the municipality levelis limited and testing of the weather indices would be approximate in nature. Further, an index capturing low probabilityhigh severity events would be easier to build in this set up rather than an index capturing high probabilitylow severity events.Yearly records of floods, droughts and typhoons are available only for last ten years for three of the individual municipalities (as discussed in the earlier section). This data is given in the Annexure. Dates of major floods in Caraga region and Butuan City were made available by OCD(given in Annexure for Butuan City, as the weather station is in Butuan City), which was extremely useful to decide trigger values for excess rainfall policies. We will try to analyze the perhectare payouts for various risks below based on this data.Review of literature on schemes in similar areasUnlike most of the other pilots where WIBI has been chiefly launched to mitigate risks faced by rain fed crops, we see that the crops in CCAP area face risk not only from scarcity of rainfall but also from floods occurring due to excessive rainfall and pests and diseases.Thus a direct application of FAO guidelines on crop water stress
26 analysis might not be sufficient to desi
analysis might not be sufficient to design WIBI policies in this terrain.Approximate models for simulating losses due to heavy rainfall will have to be used while designing a comprehensive cover.We will first look at some of the relevant Asian case studies where index basedprojects are pilotedThe nearest areaswhere WIBI policies have been tried out for corn are Thailand and Indonesia.Further, a flood insurance policy was piloted in Vietnam.In allof these countries, the effortsare still in the pilotor developmentalphase. Sompo Japan Insurance Company has launched drought insurance for rice crop in Northeast Thailand in January 2010 based on the feasibility study conducted by Japan Bank for International Cooperation in 2007. Stoppa and Manuamorn (2010) discuss about feasibility of launching WIBIpoliciesfor corn crop in East Lombok and South Sulawesi in Indonesia where there is lack of irrigation infrastructure and easy access of agricultural risk management tools. While they conclude that it is technically feasible to launch WIBI policies in the given areas, they also clarify that index insurance might not itself be sufficient to improve the livelihoods of the farming community, unless basic infrastructure like lending institutions, road etc. is in place.Skees (2008) discusses a pilot flood insurance policy offered to Vietnam Bank for Agriculture and Rural Development (VBARD) in Dong Thap province of Vietnam. Thenature of the policywasdifferent than a typical microinsurance product. This insurance covered‘business interruption’ lossesofVBARD. Such mechanisms could be helpful in reducing the basis riskinvolved in thecontracts. For example, in this case, if the farmers were individual customers of the policy, it would have been very difficult to adjust indices for individual cases, if the farmers were ragmented. But designing a mesolevel policy could balance o
27 ut differences in the payouts. However,
ut differences in the payouts. However, the policy could be sold only for a single year period and VBARD chose not to buy it in the next year.Apart from thee Asian examplesstudyconducted in Mali for insuring portfolio of lendersMarket assessmentindicate that key for success of a mesolevel insurance would depend on how well the claims trickledown to the borrowing farmers.As stated earlier, excess rainfall cover has not been offered in most of the places. But India, Mexico and Nicaragua are somenotable exceptions. Particularly in India, the insurance market for excess rainfalpolicies is quite developed. Most of the times these policies are bundled with drought index insurance so as to cover risks on both sides low as well as excess rainfall.It should be noted that excess rainfall does not necessarily cause flooding or inundation, but can surely reduce quality as well as the quantity of the production in most of the phases of the crops.In this chapter, wewill discuss topics which are not directly related to WIBI design, but are rather related to other factors critical for implementationlike marketing, sales and regulation.Client educationThe baseline study concludes that low uptake of crop insurance services could be attributed to low levels of awareness about products. In case of WIBI products,given that such products are completely unheard of,a comprehensive client education programme would be neededo ensure that the farmers understand the product features fully before they buy it. Particularly, following points need to be covered during the education campaign:Risks faced by farmers and traditional mechanisms to manage themBasic concept of probability and probable lossesSelection of best choice under probable conditionsMechanism of insuranceMechanism of WIBI vis a vis traditional indemnity policies and its meritsDemerits of WIBIDetails of WIBI policy features like pre
28 mium, index, trigger, notional etc.Exclu
mium, index, trigger, notional etc.Exclusions under WIBISales and claims related information for WIBI policyRisk management of nonweather risksCapacity assessment of insurer and aggregatorsFor any successful implementation of innovative insurance scheme, the insurer should have clear vision for the product line and should understand the benefits as well as the challenges in offering the product Guirkingker (2010), Index Insurance Innovation Initiative (I4) Scientific Committee Meeting to masses. In the current case, the higher as well as the middle management of PCIC (regional level) are found to be well aware of the facts about WIBI schemes and were found enthusiastic about the pilotThe insurer is clearly keen to develop strategies to think beyond the traditional indemnity based insurance packages and is treating WIBI as only one of the options. PCIC is also planning to pilot Area Yield Index Insurance and believes that the comparative results and experiences from both these pilots would guide the company strategy in the coming years.Representatives from RTR LGU, one of the possible aggregators, feel that WIBI would be beneficial for their farmers due to potential speedy settlementsThey are also keen to purchase mesolevel WIBI policy, whereby instead of individual farmers, their whole loan portfolio could be covered against bad weather and the individual loan waivers would then be upon the LGU’s discretion.People’s Bank of Caragaand BAUG Cooperative, which could be other potential intermediaries also responded positively to the concept.Regulatory environmentAs mentioned in the introduction, WIBI policies are actually forms of derivatives. Thus it becomes crucial to assess the insurance regulatory environment of any country trying such products. Interestingly PCIC is not governed by general insurance regulations s
29 et by Philippines’ Insurance Commis
et by Philippines’ Insurance Commission (IC). Instead, it is guided by its own board of directors. However, to ensure that WIBI could be underwritten by private insurers in the future, it would be advisable to study the acceptability of such productsby the regulatorThere have been two prior instances of WIBI policies in Philippines. They are noted below:Malayan Insurance Company, in partnership with Microensure had underwritten parametric typhoon insurance policies for a pilot region. Recently, Munich Re has initiated a project in partnership with GTZ and CLIMBS for underwriting mesolevel parametric cover and has expressed desire to scale the operations nationwide.Clearly, the insurance regulations allow such policies to be underwritten in Philippines. Of course the regulatory requirement might vary from the requirements preferred by the directors of PCIC. RecommendationsThis chapter covers specific recommendations for the CCAP project. The ‘Phased Approach’ section might be helpful for devising long term strategy for insurers and mediators, even after the closure of CCAP, which is planned in December 2011Proposednature of the contractsConsidering the risks faced by the major insurable crops, there could be three different types of covers offered under WIBI for both corn:Low rainfall cover: This could be developed using a single phase or a double phase contract.Excess rainfall cover:This could be developed using local knowledge. Though exact loss parameters are difficult to define, an approximate modeling could be possible. This policy could be useful particularly in the ‘very wet’ season, where there are recurrent floods due to heavy rainfall. Further while designing this policy, frequent events (with full payouts in less than 5 to 6 years) should not be covered as flood is a highfrequency phenomenon in the CCAP area.For rice, the products
30 could be designed for drought and excess
could be designed for drought and excess rainfall in case of rain fed farmers and for excess rainfall in case of irrigated farms. As per the inputs from the RTR municipality which is chiefly irrigated there has been almost no instance of issues due to drought due to consistently good irrigationWe tried to find details on the correlation between onset of several diseases and weather. Though most of the diseases prevail in certain weather conditions, there has been no historical track of the events. Further, the exact weather conditions are not fully known and only approximate conditions could be gathered from the local agriculturists and etymologists. Hence it would be advisable to offer WIBI policies covering only against poor weather and not again pests. However the traditional pests and disease policies of PCIC could be sold along with WIBI.A municipality wise summary of the possible products is given below: Municipality Crop Crop variety Irrigation Product S tart date End date BuenavistaRice Late maturity as well as early maturity Rainfed as well as irrigatedExcess rainfall, low rainfall Mid May 2011 Late September 2011 Buenavista Corn White OPV Rainfed Excess rainfall, low rainfall, sowing failure Early August 2011 Late November 2011 RTR Rice Late maturity as well as early maturity Irrigated Excess rainfall Mid May 2011 Late September 2011 The process of sales and claims is depicted in the flow diagram below. Each sales activity would be preceded by training. Sales of both types of products stand alone as well as credit linked are captured in the diagram. In case of claims, the farmer would be informed by the insurer through the intermediary and the claim amount would be automatically credited to the preferred account of the farmer. Pilot areasDue to constraints posed by weather data, it would be advisable to start a pilot
31 with areas nearest to the already exist
with areas nearest to the already existing synoptic weather station at Butuan Airport. Thus, the pilot product could be offered to some of the barangays of Buenavista and RTR, which have agricultural area within 20 km of radius from Butuan Airport.The number of farmers to be covered per site could be decided based on the land area under the particular crops. In consideration of the planned financial literacy programme to be conducted in close coordination with local government units and concerned stakeholders, we assume that the uptake ratio of the insurance scheme will be approximately 40 percent, the total number of farmers to be insured will be 200, and the total number of farmer participants to the financial literacy programme would be500. Keeping this as the benmark, and working based on the proportion of the land under rice and corn in both the municipalities, the distribution of the farmers could be given as follows:Municipality Area under crops Value in HectaresPercentage contribution Farmers to be educated ValueRounded valueProbable uptakeRounded value Buenavista Corn 367 11.3019 Corn 56.51 57 22.8 23 BuenavistaRice113835.0527Rice175.3175 RTRRice174253.6454Rice268.2268107.2107 Total3247Total500Total200 Feasibility of offering joint productsGiven the credit constrained scenario, it would be advisable to sell WIBI with farm loans through formal lending institutions. Standalone product could also be sold by the same institutions. However commitment from astrong lending institution partner would be the most crucial factor for ensuring success of the pilot.Phased approachThough the sections above discuss about offering WIBI for second cropping season under CCAPin 2011 in select municipalities, the concept has potential for scale up in the other municipalities of CCAP in the future, given the plan of setting up new weather measurement infrast
32 ructure of the local governmentsWe will
ructure of the local governmentsWe will discuss a possible phased approach of offering WIBI products in all the municipalities under CCAP:Given the lack of sufficient weather infrastructure in the current season, the policies could be underwritten based on Butuan City Airport weather station and could be sold in parts of Buenavista and RTR municipalities in second semester of 2011. However, assuming that at least some of the planned local weather infrastructure would be installed by the end of first semester of 2011, one can start recording the data on these stations. Once the data for a complete season is obtained, icould be studied and new contracts could be written based on the nearby weather stations where historical data is available (in this case Butuan Airport station). Season 2011 - 1 st 2011 - 2 nd 2012 - 1 st 2012 - 2 nd 2013 - 1 st 2013 - 2 nd Buenavista Installing local weather infra Designingfor season Recordinglocal weatherProduct Sales, Designing for season Recordinglocal weatherProduct sales,Modification for 2seasonRecordinglocal weatherProduct sales,Modification for 1seasonRecordinglocal weatherProduct sales,Modification for 2seasonRecordinglocal weatherProduct sales,Modification for 1season RTR Installing local weather infra Designingfor season Recordinglocal weatherProduct Sales, Designing for season Recordinglocal weatherProduct sales,Modification for 2seasonRecordinglocal weatherProduct sales,Modification for 1seasonRecordinglocal weatherProduct sales,Modification for 2seasonRecordinglocal weatherProduct sales,Modificationfor 1season Jabonga Installing local weather infra Recording local weather Recording local weather Designing for season Recording local weatherProduct Sales, Designing for season Recording local weatherProduct sales,Modification for 2season Recording local weatherProduct sales,Modificatio
33 n for 1season Las Nieves Installing Reco
n for 1season Las Nieves Installing RecordingRecordingRecordingRecordingRecording local weather infra local weather local weather Designing for season local weatherProduct Sales, Designing for season local weatherProduct sales,Modification for 2seasonlocal weatherProduct sales,Modification for 1season Reference Weather Instruments Not applicable Butuan City AirportSynoptic Weather Station Butuan City AirportSynoptic Weather Station Localstations/gaugesLocalstations/gaugesLocalstations/gauges Note: Grey area indicates the current phaseThus in case of the first season of 2012, the products could still be sold only in Buenavistaand RTR based on the data from Butuan City airport, for the second semester of 2012, products based on local weather infrastructure could be launched in all the four municipalities.Though a comprehensive plan for client education is needed in the first ew iterations, it might not be commercially sustainable for the insurer. Hence gradually the intensity of the education programme could be reduced and a thin education module could be developedin the long term.Further techniques like insurance games would be quite useful to be used at the mesolevel to train the intermediaries in the long term.Incorporating Climate Change Scenarios from PAGASAWhile logically WIBI appeals to the community working in the field of climate change adaptation, designers facseveral challenges in incorporating climate trends in the design of insurance products. Greene et al (2008)Referring to scenario prediction of future weather trends could be helpful for designers as well as the insurance portfolio managers to get a sense of overall direction of long term losses. As insurance premiums are usually calculated for the immediate next sales season it might not be advisable to introduce the long term future trends in a single season. Rather, the gradual ‘sliding win
34 dow’ approach mentioned above could
dow’ approach mentioned above could be undertaken whereby the designers closely track the gradual changes in the weather parameters, refer to the already existing scenario predictions and continuously improve the pricing. In the current project, scenarios for average daily rainfall for the years 2020 and 2050 for Butuan City Airport Weather Stationare readily being made available by PAGASA. Referring to this analysis, the vulnerability and adaptation assessment report under CCAP mentions that the daily rainfall trend across mention about three different kind of climate change scenario analysis prevalent in the sector: long term, decadal and yearly. While long term trend analysis of the historical weather data could be easier to analyze and use in the pricing of index insurance, including the much more useful dekadal and yearly variability remains a feat yet to be achieved. The same paper also mentions two different approaches of incorporating climate change: one by allowing increasing variability in the claims using the same triggers and the other by maintaining the variability in the claims by dynamically adjusting the triggers analyzing weather data in a ‘sliding window’ of around thirty years. “Climate change one decade at a time”, GreeneArthur, Goddard Lisa, Ward Neil, Siebert Asher, Holthaus Eric, Hellmuth Molly, Baethgen Walter, IRI Workshop on Technical Issues in Index Insurance, 2008 the year would remain more or less same even in 2020. However in 2050, a moderate change is predicted with very high rainfall in an alreadyfloodprone month of January and lower than the current average rainfall in the months of April and May. As explained earlier, though the pricing would not include these distant scenarios directly, the insurance designers will have to keep a continuous track on the variability
35 of rainfall in each season and adjust t
of rainfall in each season and adjust the trigger values accordingly.urce: PAGASA (June 2010)Further, PAGASA has also conducted scenario analysis for mean, minimumand maximum daily temperature for the years 2020 and 2050. This could be referred before designed temperature based weather index insurance contracts. Daily Average of Rainfall ValuesHadCM3Q0 A1B ScenarioButuan 0.02.04.06.08.010.012.014.016.0 JANFEBMARAPRMAYJUNJULAUGSEPOCTNOVDEC Rainfall Amount (mm) OBS 2020 2050 ReferencesAllen Richard, Pereira Luis, Raes Dirk, Smith Martin, “Crop evapotranspirationGuidelines for computing crop water requirements”, FAO, 1998Barnett Barry, Mahul Oliver, “Weather Index Insurance for Agriculture and Rural Areas in Lower Income CountriesAmerican Journal of Agricultural Economics, Volume 89, Issue 5, 2007Cummins J David, Mahul Oliver, “Catastrophe Risk Financing in Developing Countries: Principles for public intervention”, World Bank, 2009Gerpacio Roberta, Labios Jocelyn, Labios Romeo, Diangkinay Emma, “Maize in the Philippines production systems, constraints and research priorities”, IFAD, 2004Giannini Alessandra, Hansen James, Holthaus Eric, Ines Amor, Kaheil Yasir, Karnauskas Kristopher, Mclaurin Megan, Osgood Daniel, Robertson Andrew, Shirley Kenny, Vicarelli Marta, “Designing index based weather insurance for farmers in Central America”, IRI,Columbia University,2009Gine Xavier, Cole Shawn, Tobacman Jeremy, Topalova Petia, Townsend Robert, Vickery James, “Barriers to Household Risk Management: Evidencefrom India"Working Paper, Harvard Business School, 2009Gine Xavier, Townsend Robert, Vickery James, Statistical Analysis of Rainfall Insurance Payouts in Southern India", American Journal of Agricultural Economics, Volume, Issue , 2007Greene Arthur, Goddard Lisa, “Low frequency variability of Philippines rainfall”, I
36 RI, Columbia University, 2007Hellmuth, M
RI, Columbia University, 2007Hellmuth, Molly, Osgood Daniel, Hess Ulrich, Moorhead Anne, Bhojwani Haresh, 'Index Insurance and Climate Risk: Prospects for Development and Disaster Management', IRI, Columbia University, 2009Multiple authors, “Designing index based weather insurance for farmers in AdiHa, Ethiopia”, Report to Oxfam America, IRI, Columbia University, 2009Multiple authors, “Insurance as an adaptation under UNFCCC: A background paper”, Swiss Federal Office for Development, 2010 Osgood Daniel, “Technical hurdles in product designing”, Presentation given at the workshop on index insurance designing, IRIColumbiaUniversity, 2008Patt Anthony, Carter Michael, Hess Ulrich, Peterson Nicole, Pfaff Alexander, Suarez Pablo, Velez Maria, Helping potential market participants understand index insurance: challenges and strategies”, Draft paper presented at the workshop on index insurance designing, IRIColumbiaUniversity, 2008Roberts R A, “Insurance of crops in developing countries”, FAO, 2005SkeesJerry, Murphy Ann, Collier, Benjamin, McCord Michael, Roth Jim, “Scaling up index insurance What is needed for the next big step forward?”, Global AgRisk and Microinsurance Centre, 2007Skees Jerry, “State of knowledge report Data requirements for the design of weather index insurance”, GlobalAgRisk, 2010 Skees Jerry, Hartell Jason, Murphy Anne, Collier Benjamin, “Designing Agricultural Index Insurance in Developing Countries: A GlobalAgRisk Market Development Model Handbook for Policy and Decision Makers”, GlobalAgRisk, 2009Initial Results of Preparation Work: Caribbean Catastrophic Risk Insurance Facility”, World Bank, 2006 Annexure 1: Feasible areas that could be coveredSource: Google Maps AnnexureCCAP priority municipality locations Brief information about the municipality locations Buenavista
37 lies9 degrees 55 minutes north latitude
lies9 degrees 55 minutes north latitude and 125 degrees 25 minutes east longitude of the northeastern part of Agusan del Norte. Its boundaries are Butuan Bay to the north; Nasipit to the west; Las Nieves to the south; and Butuan City to the east. The area is made up of plains and rolling lands. The northern portion is hilly while the southern part is flat. The Poblacion and most of the barangays are located along the plain. In its eastern boundary with Butuan City lies Mt. Mayapay. Remedios T. Romualdez (RTR) is 18.80 kilometers from Butuan City. Its boundaries are Cabadbaran to the north; Magallanes to the west; Butuan City to the south; Sibagat, Agusan del Sur to the east. The municipality is composed mainly of plains with the hilly part on the east and west. Jabonga lies within the grid of 9 degrees 18 minutes to 9 degrees 23 minutes north latitude and 125 degrees 24 minutes to 125 degrees 43 minutes east longitude. Its boundaries are Kitcharao and Surigao del Norte to the north; Butuan Bay to the west; Tubay and Santiago to the south; and Surigao del Sur to the east. It is 59.70 kilometers awa from Butuan City. The topography of the municipality is generally plain to rolling and hilly. Las Nieves is characterized by rolling hills and some flat lands. It lies9 degrees north latitude and 125 degrees 30 minutes east longitude of the southern part of Agusan del Norte. Its boundaries are Butuan City to the north; Buenavista to the west; Esperanza, Agusan del Sur to the south; and Sibagat, Agusan del Sur to the east. It is 40 kilometers to Butuan City. Source: Baseline study, ILO CCAP, 2010 Las NievesJabongaRTRBuenavistaImage Source: Wikipedia Annexure 3Input costs and income for corn and ricePaddy cultivation expenses for BuenavistaYield per hectare = 3,804.07 Kg@ 80 sacks per harvest per hectare @ 50 kls per sack X 80 = 4,000 kg X P12.00/kg =
38 P48,000.00 44,760.00========== P 3,2
P48,000.00 44,760.00========== P 3,240.00 Net Income Less: Expenses forCultivation and planting = P15,000.00 b.Thresher = 8 sacks x 50 kls = 400 kls.xP12.00 = P4,800.00Transportation @ P7 per sack x 80 = P560.00d.Hauling @ P5.00 per sack x 80 = P400.00Sharing = 20 sacks x 50 kls. X P12.00 = P12,000.00Labor = P12,000.00For Trader:P 48,000.00 purchase of 4,000 kilos palay Less: 10% drying reduction 3,600 kg Expenses: X .65% recovery Milling fee = P50x46.8 = P3,276.00 ========== Labor = P5x46.8 = 234.00 2,340 kls Sacks = P8x47 = 376.00 x P37 Transportation= P15x47 = 705. ========= Drying fee P5x72 = 360.00 P86,580 = Gross Income ======= 52,951.00 P4,951.00= P33,629.00 Net IncomeRice Farmers= 4,377 Area: Irrigated 826.50 has. Rain fed 289.25 has. Paddy cultivation expenses for RTRYield per hectare = 4000 Kg@ 80 sacks per harvest per hectare @ 50 kls per sack X 80 = 4,000 kls. X P12.00/kl = P48,000.00Less:Cultivation and planting = P15,000.00 Threshers = 8 sacks x 50 kls = 400 kls.xP12.00 =P 4,800.00Transportation @ P7 per sack x 80 = P 560.00Hauling @ P5.00 per sack x 80 = P 400.00Sharing = 20 sacks x 50 kls. X P12.00 = P12,000.00Labor = P12,000.00 P44,760.00 ========== Net Income P 3,240.00 For Trader:48,000.00 purchase of 4,000 kilos palay Less: 10% drying reduction 3,600 kls Expenses: X .65% recovery Milli
39 ng fee = P50x46.8 = P3,276.00 ==========
ng fee = P50x46.8 = P3,276.00 ========== Labor = P5x46.8 = 234.00 2,340 kls Sacks = P8x47 = 376.00 x P37 Transportation= P15x47 = 705.00 ========= Drying fee P5x72 = 360.00 P86,580 = Gross Income ======= 52,951.00 P4,951.00P33,629.00Net IncomeRice farmers = 726, Area = 1,742 has (Mostly irrigated) Annexure: Partners of ILO under CCAPDepartment of Labour and Employment (DOLE):It is aprimary government agency mandated to promote employment opportunities, develop human resources, protect workers and promote their welfare. DOLE has experience in rolling out social protection schemes like Social Amelioration Fund (SAF) for sugarcane growing areas in Philippines. A similar scheme is envisaged to be implemented in the project area.Department of Trade and Industries (DTI):is another primary government agency with the dual mission of facilitating the creation of a business environment wherein participants could compete, flourish, and succeed. DTI is responsible for implementing financial schemes to provide capital to small enterprises in the project area.Department of Science and Technology (DoST):It is a primary government agency with dual mandate of providing central direction, leadership and coordination of all scientific and technological activities, and of formulating policies, programs and projects to support national development.One of the deliverables of the project is to capacitate people to tackle with the climatic disasters. This would be achieved through setting up early warning systems across the selected municipal areas with an active help from DoST.Phil
40 ippines Crop Insurance Corporation (PCIC
ippines Crop Insurance Corporation (PCIC):PCIC is the key implementing agency of the agricultural insurance program of the government. Apart from indemnity based crop insurance, PCIC has experience of underwriting insurance packages for livestock, personal accident, life, warehouses, rice mills, irrigation facilities and other farm equipment. It should be noted that PCIC is the sole crop insurance underwriter in Philippines. PCIC is keen to underwrite better crop insurance products like area yield index insurance and weather index insurance.Agusan del Norte Provincial Government: The provincial government through its municipal level employees is expected to play a major role in actual implementation of the schemes under CCAP. AnnexureYield for Rice and Corn Agusan del NorteSource: Bureau of Agriculture Statistics, Agusan del NorteSource: Bureau of Agriculture Statistics, Agusan del Norte 0.51.52.53.54.5 1997 199819992000200120022003 2004 Mt. per HectareRice Yield Agusan del Norte JanJuneIrrigated JulDecIrrigated JanJuneRainfed JulDecRainfed 0123456891019941995 1998 1999200020012002 2007 Mt. Per HectareCorn Yield Agusan del Norte Yellow Corn Jul to Dec Yellow Corn - Jan to June White Corn - Jul ty Dec White Corn Jan to June Yield for major crops in RTR (MT per hectare) CommoditiesYear 2002 2003 2004 2005 2006 2007 2008 2009 Rice 1st copping 4.00 4.08 4.97 4.73 4.62 4.44 4.54 4.14 Rice 2nd copping 4.02 4.29 5.19 5.03 4.95 5.39 5.05 4.87 Abaca1.251.251.251.251.251.261.271.295 Banana 12.03 12.5 11.8 12.2 11.82 10.483 9.908 9.5583 Source: Vulnerability and Adaptation Assessment report, ILO CCAP Annexure: Major floods in Butuan City No. Date of Occurrence Type of Disaster No. of Affected Barangays Affected Population Evacuated Population Damage Houses Casualties Total Cost of Damages Fa mi
41 li es Perso ns Fami lies Perso ns Tot a
li es Perso ns Fami lies Perso ns Tot ally Partia lly To tal De ad Injur ed Miss ing To tal Agricult ure (in pesos) Infra (in pesos) Total (in pesos) February Flashflood due to La Nina271,953,130.0079,5400.00000.00 February Flashflood685,650.0025,300,000.0025,985,650.00 3 February 1619, 2001 Flood due to continuous heavy rains 3,6 17,27 0 0 0 0 0 0 0 0 0 4,355,000.00 8,000,000.00 12,355,000.00 Dec. 30, 2001 January 12, Flashflood due to continuous heavy rains52,262,3837,42533,820,000.0029,240,000.0063,060,000.00 5 October 24, Flashflood due to Continuous heavy rains 2 523 3,138 0 0 1 19 20 0 0 0 0 P456,885.00 P10,350.00 P467,235.00 February 815, 2004 Flood due to continuous heavy rains 51,551,4621,169,645.001,169,645.00 7 Feb. 13, 2006 Flooding due to 55 22, 618 115,3 01 1,15 3 5,718 17,015, 970.00 50,960,000.0067,975,970.00 Monsoon rains January 215, Flooding due to Monsoon rains 7,431,49 January 1018, 2009Continuous heavy rains due to the tailend of a cold front1,992 November 20 25, 2009Continuous heavy rains for five (5) days1,423 Source: OCD, Caraga regional office Annexure: Rice claims data for Agusan del Norte Rice Flood and typhoonDroughtPestsDiseases FarmersArea (Ha)Claims (Pesos)FarmersArea (Ha)Claims (Pesos)FarmersArea (Ha)Claims (Pesos)FarmersArea (Ha)Claims (Pesos) 200140.2549041.7914.55340219833277861615691.24 200238.54965024.75108195.7391611.713300247.512240.5 200367.3123211.738289208296.25737524.2172.2579500.29 2004 2558693 173129.1 870439.3 387466.5 2005 8320 6942.28 1213018 2006166.25411715 433707.2517258557056 200743.593480 462761.5122741521.2541670 200822.2566929 429728108967340017 2009145.75407596103173.9578124242407.96829550147215.79384175 Source: PCIC, Regiona