
understand how well students are learning and progressing Outcomes data not only provides a broad understanding of student achievement it also illuminates where achievement gaps persist in our c ID: 851519
Download Pdf The PPT/PDF document "We all rely on academic outcomes data to" is the property of its rightful owner. Permission is granted to download and print the materials on this web site for personal, non-commercial use only, and to display it on your personal computer provided you do not modify the materials and that you retain all copyright notices contained in the materials. By downloading content from our website, you accept the terms of this agreement.


1 We all rely on academic outcomes data to
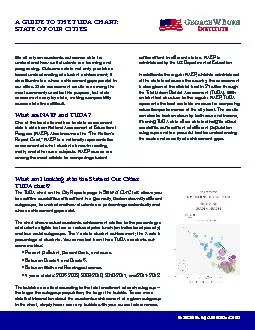
We all rely on academic outcomes data to understand how well students are learning and progressing. Outcomes data not only provides a broad understanding of student achievement; it also illuminates where achievement gaps persist in our cities. State assessment results are among the most commonly used for this purpose, but state assessments vary by state, making comparability across state lines di�cult. What are NAEP and TUDA? One of the best alternatives to state assessment Progress (NAEP). Also known as the “The Nation’s Report Card,” NAEP is a nationally representative assessment of what students know in reading, math, and other core subjects. NAEP scores are among the most reliable for comparing student achievement in di�erent states. NAEP is administered by the US Department of Education. In addition to the regular NAEP, which is administered at the state level across the country, the assessment is also given at the district level in 21 cities through the Trial Urban District Assessment (TUDA). With an identical structure to the regular NAEP, TUDA represents the best available measure for comparing education performance at the city level. The results can also be broken down by both race and income, academic achievement of di�erent population subgroups and is a powerful tool for understanding the scale and severity of achievement gaps. BushCenter.org/StateOfOurCities What am I looking at in the State of Our Cities TUDA chart? The TUDA chart on the City Reports page in State of Our Cities allows you to examine academic achievement in a given city, broken down by di�erent subgroups, to understand how students are performing academically and where achievement gaps exist. The chart shows actual academic achievement relative to the percentages of students eligible for free or reduced-price lunch (an indicator of poverty) and four racial subgroups. The Y axis is student achievement; the X axis is percentage of students. You can select from three TUDA academic out - come metrics: • Percent pro�cient, percent basic, and score. • Between Grade 4 and Grade 8. • Between Math and Reading outcomes. • 4 years of data: 2008-2009, 2009-2010, 2010-2011, and 2011-2012. The bubbles are sized according to the total enrollment of each subgroup— the larger the subgroup population, the larger the bubble. To see more detailed information about the academic achievement of a given subgroup in the chart, simply hover over any bubble with your cursor to learn more. A GUIDE TO THE TUDA CHART: STATE OF OUR CITIES