
m deformation or strain is measured and plotted as a function of elapsed time as illustrated in figure 2 For metallic materials most creep tests are conducted in uniaxial tension using a specimen having the same geometry as for tensile tests ID: 1021972
Download Presentation The PPT/PDF document "Creep Test A typical creep test consists..." is the property of its rightful owner. Permission is granted to download and print the materials on this web site for personal, non-commercial use only, and to display it on your personal computer provided you do not modify the materials and that you retain all copyright notices contained in the materials. By downloading content from our website, you accept the terms of this agreement.


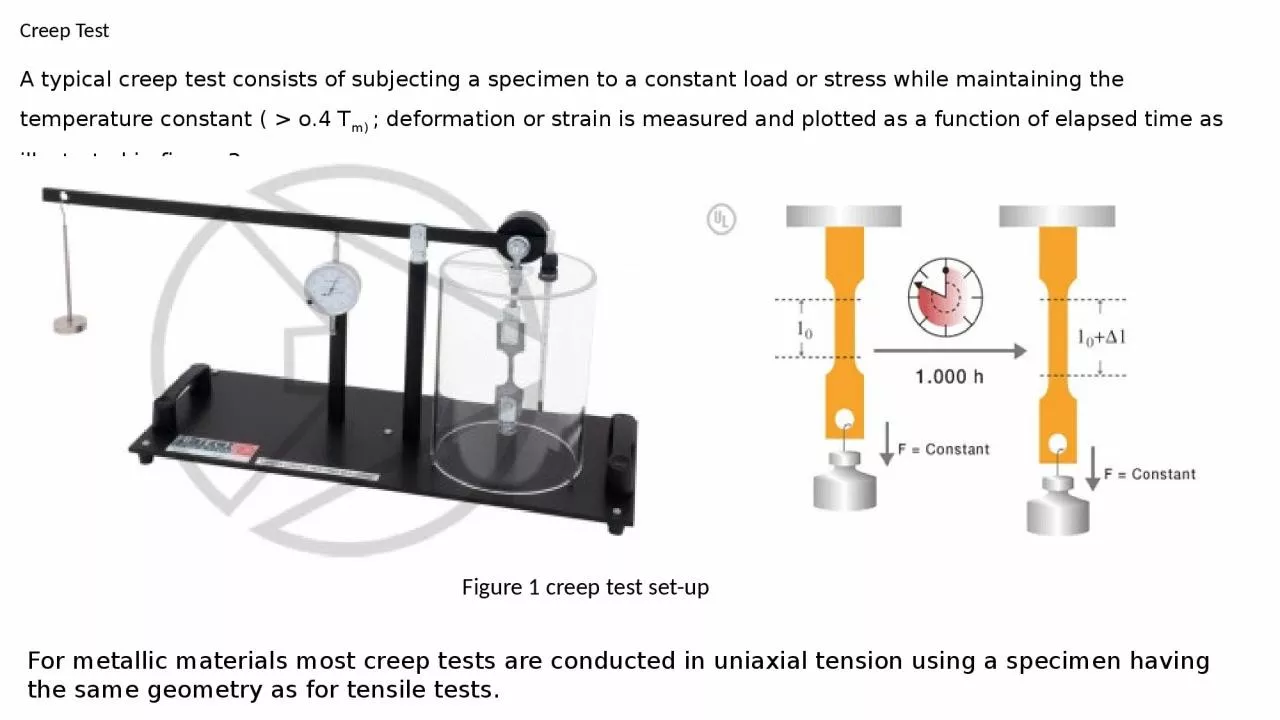
1. Creep TestA typical creep test consists of subjecting a specimen to a constant load or stress while maintaining the temperature constant ( > o.4 Tm) ; deformation or strain is measured and plotted as a function of elapsed time as illustrated in figure 2. For metallic materials most creep tests are conducted in uniaxial tension using a specimen having the same geometry as for tensile tests.Figure 1 creep test set-up
2. Fig (2) Typical creep curve of strain versus time at constant stress and constant elevated temperature
3. Creep Stages: Following the instantaneous deformation (elastic region), there are three stages: 1-Primary Creep: starts at a rapid rate as a result of dislocations movements and slows with time due to the work hardening (low temperature) which ties-up the dislocations at grain boundaries. 2- Secondary Creep: has a relatively uniform strain rate due to the balance between work hardening and annealing (thermal softening). This is often the stage of creep that is of the longest duration 3- Tertiary Creep: has an accelerated creep rate and terminates when the material breaks or ruptures. This acceleration due to with the formation of voids and micro-cracks at grain boundaries.
4. Figure -3- Cavity coalescence at grain boundariesCavitation Phenomenon:In tertiary region, rupture occurs due to the pore formation (cavitation) at grain boundaries.Cavities form on grain boundaries that are perpendicular to the applied forceEliminating the grain boundaries altogether should enhance the creep-rupture lifeThis was the motivation for developing single crystal alloys.
5. Creep Test. Stress Rupture TestMeasures strain versus time at constant temperature and load or stressMeasures stress versus time to rupture at constant temperatureRelatively low loads and creep rates.Higher loads and creep ratesLong duration, 2,000 to 10,000 hours. Not always to fracture.... Shorter duration, less than 1,000 hours typically. Always to fractureStrain measured accurately using sensitive equipment (inductance gauges) to determine creep rate. Strains typically less than 0.5%.Simpler less sensitive strain measuring equipment (dial gauges). Time and strain to fracture measured. Strains typically up to 50%.Design ParametersMost important design parameters in creep are:Measure Steady state creep rateMeasure Rupture life time tr (stress rupture test). Similar to creep test except the stress is higher Note: both of designs strongly depend on temperature and stress applied
6. Fig (3): Effect of temperature and stress on creep behavior
7. Data extrapolation method One of the most popularly used techniques in representing creep-rupture data is Larson-Miller Time –temperature parameters. This parameter can be derived from the stress and temperature dependence of the creep rate or time to rupture. The rate equation generally can be written in the form of the Arrhenius equation and expressed as PLM= T [C + log (tr)]where C is a constant (usually on the order of 20), for T in Kelvin and the rupture lifetime in hours, PLM is Larson-Miller parameter. Example: Using the Larson–Miller data for S-590 iron shown in Figure 4, predict the time to rupture for a component that is subjected to a stress of 140 MPa at 800 CSolutionFrom Figure 4 , at 140 MPa the value of the Larson–Millerparameter is 24x103 , for T in K and in h; therefore, 24x103 = T [C + log (tr)]24x103 = ( 800+273) [ 20+ log (tr)]20+ log (tr) = 22.37tr= 233 hour (9.7 days).
8. Figure -4- Logarithm stress versus the Larson–Miller parameter for an S-590 iron.
9. Design Considerations to avoid Creep •Reduce the effect of grain boundaries: •Use single crystal material with large grains. •Addition of solid solutions to eliminate vacancies. •Employ materials of high melting temperatures. .