
ZALT September 2020 777 South Flagler Drive Suite 800 West Tower West Palm Beach FL United States 33401 800 380 9342 serviceZEGAFinancialcom ID: 842258
Download Pdf The PPT/PDF document "ZEGAs Alternative Income Strategy" is the property of its rightful owner. Permission is granted to download and print the materials on this web site for personal, non-commercial use only, and to display it on your personal computer provided you do not modify the materials and that you retain all copyright notices contained in the materials. By downloading content from our website, you accept the terms of this agreement.


1 ZALT ZEGA's Alternative Income Strateg
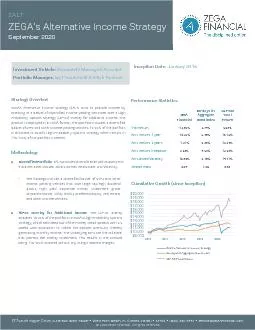
ZALT ZEGA's Alternative Income Strategy September 2020 777 South Flagler Drive , Suite 800 West Tower ⢠West Palm Beach, FL (United States) ⢠33401 ⢠(800) 380 - 9342 ⢠service@ZEGAFinancial.com © 20 20 ZEGA Financial. All rights reserved. Strategy Overview ZEGAâs Alternative Income Strategy (ZALT) aims to provide income by investing in a basket of diversified income yielding securities with a High Probability Options Strategy ( HiPOS ) overlay for additional income. The product is deployed in an SMA format. The portfolio includes a diversified basket of ETFs and other income yielding vehicles. 15 - 25% of the portfolio is allocated to ZEGAâs High Probability Options Strategy which results in 115 - 125% of the portfolio invested. Methodology ⢠Diversified Portfolio: ZALT provides diversification with exposure to 4 distinct asset classes: Stocks, Bonds, Real Estate, and Volatility. â The holdings include a diversified basket of ETFs and other income yielding vehicles that own large cap high dividend stocks, high yield corporate bonds, investment grade corporate bonds, utility stocks, preferred equity, real estate, and other income vehicles. ⢠HiPOS Overlay for Additional Income: The HiPOS overlay allocates 15 - 25% of the portfolio to ZEGA's High Probability Options Strategy, which sells deep out - of - the - money credit spreads with 3 - 5 weeks until expiration to collect the options premium, thereby generating monthly income. The underlying ETFs a re the collateral that permits the overlay investment. This results in the account being 115 - 125% invested without any margin interest charges. ZEGA Financial Barclays US Aggregate Bond Index S&P 500 Total Return YTD Return - 12.85% 6.79% 5.58% Ann. Return: 1 year - 10.26% 6.98% 15.16% Ann. Return: 3 years - 1.31% 5.25% 12.29% Ann. Return: Inception 2.30% 4.53% 13.32% Annualized Volatility 10.80% 3.18% 14.71% Sharpe Ratio 0.24 1.06 0.83 Cumulative Growth (since inception) $9,000 $10,000 $11,000 $12,000 $13,000 $14,000 $15,000 $16,000 $17,000 $18,000 $19,000 $20,000 2016 2017 2018 2019 2020 ZEGA's Alternative Income Strategy Barclays US Aggregate Bond Index S&P 500 Total Return Investment Vehicle: Separately Managed Account Portfolio Manager: Inception Date: January 2016 Performance Statistics Jay Pestrichelli & Mick Brokaw ZALT ZEGA's Alternative Income Strategy September 2020 777 South Flagler Drive , Suite 800 West Tower ⢠West Palm Beach, FL (United States) ⢠33401 ⢠(800) 380 - 9342 ⢠service@ZEGAFinancial.com © 20 20 ZEGA Financial. All rights reserved. Recommended Usage The ZEGA Alternative Income Strategy (ZALT) is designed for a conservative investor. Returns are driven by growth and income, and so the strategy can replace an equity or fixed income allocation in a blended portfolio. We recommend the strategy as an alternative to ZEGA's HiPOS Aggressive for clients with less risk tolerance. Preferred usage in margin enabled accounts. Monthly Performance Risk vs. Return Strategy Risks & Disclosures Note: Returns are expressed in US Dollars and calculated net of actual fees. Performance includes reinvestment of dividends and other earnings. ZEGA Financial is a registered investment adviser and investment manager that specializes in derivatives. ZEGA is a separate accounts manager and
2 all returns expressed herein are solely
all returns expressed herein are solely from the separate accounts business within ZEGA. ZEGAâS ALTERNATIVE INCOME STRATEGY (ZALT ) COMPOSITE includes all institutional and retail portfolios that invest in a basket of diversified high - yield holdings, with a HiPOS overlay for additional income. The holdings include a diversified basket of ETFs and other income yielding vehicles that o wn large cap high dividend stocks, investment grade corporate bonds, high yield (junk) corporate bonds, utility stocks, preferred equity, real estate, and other income vehicles like MLPs. T he HiPOS overlay allocates 15 - 25 % of the portfolio to ZEGAâs High P robability Options Strategy, which sells deep out - of - t he - money credit spreads with 3 - 5 weeks until expiration to collect the options premium â thereby generating monthly income. The underlying ETFs are the collateral that permits the overlay investment. Thi s composite includes all portfolios that were at least 70% dedicated to this strategy. The benchmark is the Barclays US Aggregate Bond In dex. This Barclays Index is a market cap weighted index of fixed income securities and it widely considered the most us ed index in the fixed income investment community. ZEGA Financial claims compliance with the Global Investment Performance Standards (GIPS). To receive a full list of composite descriptions of ZEGA Financial and/or a presentation contact Jay Pestric helli at 1 - 800 - 380 - 9342, ext 101 or jay.pestrichelli@zegafinancial.com . All investments involve the risk of potential investment losses as well as the potential for investment gains. Prior performa nce i s no guarantee of future results and there can be no assurance, and clients should not assume, that future performance of any of the model portfolios will be comparable to past performance. These results should not be viewed as indicative of the advisorâ s skill. The prior performance figures indicated herein represent portfolio performance for only a short time period, and may not be indicative of the returns or volatility each portfolio will generate over a long time period. The performance presented sho uld also be viewed in the context of the broad market and general economic conditions prevailing during the periods covered by the performance information. The actual results for the comparable periods would als o have varied from the presented results base d upon the timing of contributions and withdrawals from individual client accounts. The performance figures contained herein should be viewed in t he context of the various risk/return profiles and asset allocation methodologies utilized by the asset alloca tion strategists in developing their model portfolios, and should be accompanied or preceded by the model. Standard deviation is a measure of the dispersion of a set of data from its mean. The more spread apart the data, the higher the deviation. In finan ce, standard deviation is applied to the annual rate of return of an investment to measure the investment's volatility. Year Jan Feb Mar Apr May Jun Jul Aug Sep Oct Nov Dec YTD Barclsys US Aggregate Bond Index 2016 - 0.66% - 0.57% 5.91% 1.05% 1.12% 2.28% 1.21% - 0.93% 0.08% - 1.84% - 0.94% 1.45% 8.23% 2.66% 2017 1.45% 1.98% 0.22% 0.39% 0.59% 0.83% 0.97% 0.23% 0.24% 0.12% 0.55% 0.25% 8.09% 3.55% 2018 - 0.36% - 1.61% 0.31% 0.73% 1.06% 0.77% 1.12% 0.58% - 0.37% - 2.05% 0.97% - 3.81% - 2.76% 0.02% 2019 5.72% 0.30% 0.59% 0.52% - 0.53% 1.51% 0.50% - 1.24% 1.58% 1.13% - 0.01% 1.83% 12.39% 8.73% 2020 - 0.68% - 11.67% - 14.39% 6.53% 3.18% 0.81% 4.81% 0.28% - 0.36% - 12.85% 6.79% ZEGA's Alternative Income Strategy S&P 500 Total Return Barclays US Aggregate Bond Index 0% 5% 10% 15% 0% 5% 10% 15% 20% ANNUALIZED RETURN ANNUALIZED STANDARD DEVIATION