
Presented by Nelson Wu Team Members Cong Zhang and Tom Zhou Client Dr Jeffrey Brooks DPM Need Diabetes mellitus attributed to malfunction of insulin production a molecule that regulates blood glucose concentrations within the body ID: 376488
Download Presentation The PPT/PDF document "Bloodless Glucose Monitor" is the property of its rightful owner. Permission is granted to download and print the materials on this web site for personal, non-commercial use only, and to display it on your personal computer provided you do not modify the materials and that you retain all copyright notices contained in the materials. By downloading content from our website, you accept the terms of this agreement.


Slide1
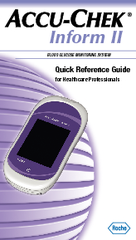
Bloodless Glucose Monitor
Presented by: Nelson Wu
Team Members: Cong Zhang and Tom Zhou
Client: Dr. Jeffrey Brooks, D.P.M.Slide2
Need
Diabetes mellitus attributed to malfunction of insulin production, a molecule that regulates blood glucose concentrations within the body
Normal
glucose level: 70 to 110 mg/
dL
Blood glucose spike to 180 mg/
dL
after meals
Normally brought back down by insulin
Stay high for 3
hours
for people with diabetesSlide3
Finger Prick- The Gold Standard
Performs glucose oxidation and measures changes in sample
Costs approximately $1000 per year in test strips
Requires
puncturing the
skin which often results in neuropathyPatient is only willing to puncture skin so many times per day, limiting effectiveness of monitoringSlide4
Specific Design Requirements
Device does not require implanted parts or physically puncturing the user
Device
gives results in a reasonable time frame (within 1 minute)
Device displays blood glucose in standard units (mg glucose/
dL blood)Device warns user on detection of dangerous glucose levels (>200mg/dL or <70mg/dL)
Device is lighter than 20 N and smaller than 200 cm3Device contains internal power for one month of testing (10 W-hr)Device is accurate within 10% of the commercially-available methods at least 95% of the timeSlide5
Design Possibilities
Reverse
Iontophoresis
Photoacoustic
Effect
Optical Coherence TomographyMultispectral PolarimetryNear-Infrared SpectroscopyRaman SpectroscopySlide6
Reverse Iontophoresis
Extracting glucose in fluid drawn from skin using electrical current
Example: G2
Glucowatch
, US patent 20080058627
Causes skin irritationRequires daily “finger-prick” calibrationDisrupted by sweatingSlide7
Photoacoustic
Effect
Use laser pulse to heat tissue
Measure thermal tissue expansion and acoustic wave
Calculate fluid viscosity and correlative glucose
concentrationNot affected by water itself due to poor responseFluid viscosity confoundedSlide8
Multispectral
Polarimetry
Measures the
intensity of collected
polarized light
. Requires low turbidity (i.e. aqueous humor of the eye)Unaffected by temperature and pHTime lagSlide9
Optical Coherence Tomography
Based
on the delay of
backscattered light
compared to the light reflected by the reference
arm mirrorHigh resolution two-dimensional images by in-depth and lateral scanning Twenty minute lag from blood glucose
levelsThe refractive index of the interstitial fluid increases in response to increase in its glucose concentrationSensitive to motion artifacts and changes in skin temperatureSlide10
Near Infrared Spectroscopy
Raman Spectroscopy
Measures elastic scattering of light
Strong Water Spectrum
785 nm for
1 m
m tissue penetrationWeak tissue autofluorescenceLess photodamageMeasures inelastic scattering of light
Weak Water Spectrum
785 nm for
1
mm
tissue penetration
Weak tissue
autofluorescence
Less
photodamageSlide11
Raman
Spectroscopy
785 nm incident
861 nm Glucose
893 nm
hemoglobinSlide12
Invasive:
Blood pricking method
Reverse
Iontophoresis
Indirect:
Photoacoustic
Effect
Non-invasive
Elastic:
NIR Spectroscopy
Direct
Monitor location: Eye
Multispectral
Polarimetry
Monitor location: Skin
Interstitial Space:
Optical Coherence Tomography
Overview
Capillaries
Inelastic:
Raman SpectroscopySlide13
Analysis to Choose Design
Option
Non-invasive
Accuracy
Portability
Ease of UseCostTotal
Blood
Prick
1
5
5
4
3
18
Reverse
Iontophoresis
3
3
5
2
3
16
Photoacoustic
Effect
5
2
3
2
2
14
Multispectral
Polarimetry
5
4
2
1
3
15
Optica
l Coherence Tomography 5323215NIR5354320
Raman
55543-423Slide14
Optical Elements
Laser source
Beam
splitters
Objective
and focusing lensBandpass filtersPhotodetectorsNon-Optical ElementsData acquisition (DAQ) analogue to digital converter (ADC)
Computation circuit boardDisplayBatteryCaseSpecific Details of Chosen DesignSlide15
Laser source
QL7816S-B-L
785 nm, 25
mW
, Ø5.6 mm, B Pin Code Laser
DiodeThe laser diode provides a single wavelength light sourceA single wavelength light source is preferable to a source of a broad range of wavelengths
As the spectral peaks of glucose and hemoglobin are relative to wavelength of the simulation laser, broader simulation sources will result in broader spectral peaks. Slide16
Collimating Lens
LT220P-B
Collimation Tube with Optic for Ø5.6 and Ø9 mm Laser Diodes
,
f = 11.0
mmConverts the diverging light from the laser diode to parallel laser light, needed to progress through preceding optical elements
The main consideration of the collimation tube is the width of output collimated lightA width too narrow is prone to optical misalignment whereas a width too wide increases the sizes of optical elements requiresSlide17
Beam splitters
BS011
50:50 Non-Polarizing
Beamsplitter
Cube, 700-1100 nm, 10
mmThe main considerations for the beam splitters is the ratio of light intensity between the split. This ratio determines how much of the incoming light will be transmitted through the cube versus deflected 90 degrees. Slide18
Objective (focusing) lens
C240TME-B
f = 8.0 mm, NA = 0.5, Mounted
Geltech
Aspheric Lens, AR: 600-1050
nmThe objective lens is used to focus the collimated laser light to a focused spot in the skin, and to capture and collimate the backscattered Raman signal. The lens must also focus the laser light to a point on a blood vessel near the surface of the skin, as the optical penetration depth at 785 nm is around 1 mm in tissue. Slide19
Bandpass
filters
Hemoglobin
Bandpass
filter: FB890-10
Ø1in Bandpass Filter, CWL = 890 ± 2 nm, FWHM = 10 ± 2 nm Glucose bandpass filter: FB860-10
Ø1in Bandpass Filter, CWL = 860 ± 2 nm, FWHM = 10 ± 2 nm Slide20
Photodetectors
FDS100
Si Photodiode, 10 ns Rise Time, 350 - 1100 nm, 3.6 mm x 3.6 mm Active Area
The
photodetector
outputs a current indicative of measured light intensity.Two photodetectors are used in the device: one to measure the intensity of the glucose peak, the other to measure the intensity of the hemoglobin peak.Slide21
Updated Design ScheduleSlide22
Updated Team Responsibilities
Nelson Wu
Contact for Client
Website Moderator
Knowledge
on alternative spectroscopiesCong ZhangKnowledge on Optical ComponentsKnowledge on Raman Spectroscopy
Tom ZhouKnowledge on Non-Optical ComponentsProgrammerSlide23
Questions?Slide24
References
1. Kong et al. “Clinical Feasibility of Raman Spectroscopy for Quantitative Blood Glucose Measurement.” Massachusetts Institute of Technology. 2011.
2.
Larin
, K. V., M. S.
Eledrisi, M. Motamedi, and R. O. Esenaliev. "Noninvasive Blood Glucose Monitoring With Optical Coherence Tomography: A Pilot Study In Human Subjects ." Diabetes Care 25.12 (2002): 2263-2267. Print.
3. N.D. Evans, L. Gnudi, O. J. Rolinski, D. J. S. Birch, and J. C. Pickup. “Non-invasive glucose monitoring by NAD(P)H Autofluorescence spectroscopy in broblasts and adipocytes:a model for skin glucose sensing.” Diabetes Technology and Therapeutics 5 (2003): 807-816. Print.
4.
Pishko
, Michael V.. "Analysis: Glucose Monitoring By Reverse
Iontophoresis
." Diabetes Technology Therapeutics 2.2 (2000): 209-210. Print.
5.
Plaitez
, Miguel, Tobias
Leiblein
, and Alexander Bauer. "In Vivo Noninvasive Monitoring of Glucose Concentration in Human Epidermis by Mid-Infrared Pulsed
Photoacoustic
Spectroscopy." Analytical Chemistry 85.2 (2013): 1013-1020. Print.
6. Potts,
Russel
, Janet
Tamada
, and
Micheal
Tearny
. "Glucose monitoring by reverse
iontophoresis
." Diabetes/metabolism research and reviews 18 (2002): 49-53. Print.
7. Shao et al. “In Vivo Blood Glucose Quantification Using Raman Spectroscopy.” Fuzhou University. 2012.
8.
Thenadil
, Suresh, and Jessica
Rennert
. "Comparison of Glucose Concentration in Interstitial Fluid, and Capillary and Venous Blood During Rapid Changes in Blood Glucose Levels." Diabetes Technology & Therapeutics 3.3 (2004): 357-365. Print.
9. Whiting, D., Weil, C., & Shaw, J. (2011). IDF Diabetes Atlas: Global estimates of the prevalence of diabetes for 2011 and 2030. Diabetes Research and Clinical Practice, 94(3), 311-321.
10.
Vashist
, Sandeep. "Non-invasive glucose monitoring technology in diabetes management: A review." Analytica
Chimica Acta 750 (2012): 16-27. Print.11. Yang, Chaoshin
, Chiawei Chang, and Jenshinn Lin. "A Comparison between Venous and Finger-Prick Blood Sampling on Values of Blood Glucose." International Conference on Nutrition and Food Sciences 39 (2012): 207-210. Print.12. Zhang, Ping, Xinzhi Zhang, and Jonathan Brown. "Global healthcare expenditure on diabetes for 2010 and 2030." Diabetes Research and Clinical Practice 87.3 (2010): 293-301. Print.