

WA State Applied Baccalaureate Degrees Joyce Hammer PhD Director of Transfer Education SBCTC Malcolm Grothe PhD Assoc ViceChancellor Seattle Colleges BAS Annual Conference November 14 2017 ID: 767333
Download Presentation The PPT/PDF document "WA State Applied Baccalaureate Degrees" is the property of its rightful owner. Permission is granted to download and print the materials on this web site for personal, non-commercial use only, and to display it on your personal computer provided you do not modify the materials and that you retain all copyright notices contained in the materials. By downloading content from our website, you accept the terms of this agreement.


WA State Applied Baccalaureate Degrees Joyce Hammer, Ph.D.Director of Transfer Education, SBCTCMalcolm Grothe, Ph.D.Assoc. Vice-Chancellor, Seattle Colleges BAS Annual Conference November 14, 2017
National AB Degrees Source: CCBA http://www.accbd.org/resources/baccalaureate-conferring-locations
States Offering AB Degrees *Authorized but not offering3 1. New York 1970 12. Minnesota 2003 * 2. West Virginia 1990 13. New Mexico 2004 3. Utah 1992 * 14. Indiana 2004 4. Vermont 1993 15. Washington 2005 5. Idaho 1995 * 16. Georgia 2005 6. Arkansas 1997 * 17. North Dakota 2006 7. Florida 1997 18. Oklahoma 2006 8. Nevada 1998 19. Wisconsin 2010 9. Louisiana 2001 * 20. Michigan 2012 10. Hawaii 2003 21. Colorado 2014 11. Texas 2003 22. California 2014 23. Delaware 2016
Applied Baccalaureate Demographics (2015-16) Student profile:33 average age37% part-time 54% female 38% students of color- Asian and Hispanic fastest growing groups 68% entered with an Associate degree from WA; 7% with a prior bachelor’s 4
Often called BAS/BSN Builds off of professional/technical associates degree (e.g. AAS-T)180 credits Minimum 60 credits general education 120 credits applied/core courses Includes upper/lower division courses Regional university tuition rate WA Applied Baccalaureate Degrees
Tuition and Fees 6
History 2005 pilot (Bellevue, Olympic, Peninsula, South Seattle), 2010 regular status 2012 SBCTC authorized to approve 2017-2018 : 90 programs at 28 colleges 2015-16: 1633 FTES enrolled, 2167 headcount, 474 Completions 2016-2017: 2222 FTEs enrolled, 3036 headcount, 733 Completions Enrollments are 1.3% of total enrollments in college system
8
9
10
11
Increase education pathways for diverse workforce student population Meet state goals for baccalaureate degrees awarded Increase CTC applied baccalaureate graduates to 1400 per year by 2030Expand workforce mission of CTCsIncrease earning potential Why BAS Programs at CTCs?
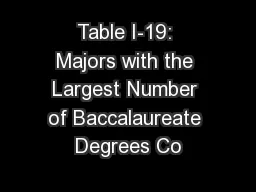
Applied ManagementInformation Technology (e.g. networking admin. systems software, application development) NursingDental HygieneFuneral Services EducationHealth professions (e.g. health infomatics and management Cybersecurity Teacher Education/Early Childhood Education Natural Resources and Conservation or Sustainability Program Trends
Applied Baccalaureate Timeline 14 1. College informs SBCTC of intent 2. SBCTC staff informs higher education community of intent through ICAPP grid 3. College develops Statement of Need 1. SBCTC staff informs all two-year, four-year, higher education institutions of new program for public comment 2. SBCTC staff reviews Statement of Need based on approval criteria adopted by State Board 1. Statement of Need is discussed by State Board in study session 2. College develops Program Proposal 1. SBCTC staff in collaboration with Instruction Commission reviews Program Proposal 2. Peer Review of Program Proposal for colleges new to accredited BAS degrees
Applied Baccalaureate Timeline 15 1. Program proposal is scheduled with State Board for approval 2. If approved… 1 . College moves program to NWCCU for Accreditation 2 . College submits application for Veterans Services approval 3 . Nursing Commission ( if applicable) 1. College moves program to Department of Education for Financial Aid approval 2. Program Implementation
February 7-8 2018 State Board Meeting (Olympia) 16 Statement of Need: Due November 1, 2017 Program Proposal: Due November 20, 2017 –within approx.12 months of SBCTC receiving the Statement of Need.
Statement of Need Criteria Institutional role, mission, program prioritiesStatewide strategic plan Employer/local demand/ higher wage jobs Existing professional and technical degree program Student demand/place-bound factors Conversations with universities/brief program outcomes
Proposal Criteria Curriculum rigorQualified facultyAdmissions processStudent Services Financial commitment Accreditation Pathway options beyond applied baccalaureate/external reviewers
Identifying Program Demand 19Employers demand the level of technical training proposed Leads to high wage-earning jobs Fills a gap in options available for students because it is not offered by a public four-year institution of higher education in the college's geographic area.
Presenting the Supply/Demand Gap 20 For demand : Provide local/regional demand data for the targeted occupation job title(s) from traditional labor market data, industry data, trade association data, or other transactional data. (Provide absolute numbers , not just percentages) For supply gap : Provide data on the number of programs and the number of annual program graduates for all four-year colleges that supply your region . Is the number of current annual graduates insufficient to meet current and projected demand? (The result of demand minus supply).
Employer Survey 21Provide demand information from: at least 25 individual employer responses or; employers who comprise at least 75% of the identified employment base.
Economic Modeling Specialists Intl. Employment Security Department-WA StateMonthly Employment ReportLocal area demand/decline occupations Employer demand reports Burning Glass Moving the Goalposts: How Demand for a Bachelor’s Degree Is Reshaping the Workforce 22 Tools to Identify Supply/Demand
BAS Budget Development 23 Identify the program Demonstrate the need Quantify the enrollment Identify start-up costs Identify annual program costs FTE or Self support
24 First Applied Baccalaureate Degree Projected Expenses Expense Year 0-2015/2016 Year 1 -2016/2017 Year 2 – 2017/2018 FT Faculty (Instruction - 1.0 FTE after Year 1) $ - $ 20,460 $ 62,000 PT Faculty (Instruction - .66 FTE after Year 1) $ - $ 4,303 $ 23,839 Curriculum/ Program Development $20,000 $ 30,000 $ 10,000 BAS Program Manager (1FTE) $ 28,000 $ 56,000 Librarian (.25 FTE) $ 15,500 $ 15,500 Financial Aid (.25 FTE) $ 5,000 $ 10,000 Credentials (.25) $ 5,000 $ 10,000 Clinical/Practicum coordinator (.5FTE) $ - $ 22,000 Total personnel $108,263 $209,339 Benefits (35%) $ 37,892 $ 73,269 $146,155 $282,608 Library Resources $ - $ 30,000 $ 20,000 Goods and Services $ 5,000 $ 4,000 Marketing and Outreach $ 5,000 $ 3,000 Equipment purchases and replacement (1 lab) $ 30,000 $ - Professional Development, Research, and Travel $ 10,000 $ 10,000 Projected Expenses $226,115 $319,608
25 Year 1 Year 2 Year 3 Year 4 Year 5 Times the number of students in each type: # of students at FT tuition (annual) 20 38 38 38 38 # of students at FT non-resident tuition (annual) 2 3 3 3 # of students at 10 credits/qtr (annual) 10 10 10 10 10 # of students at 5 credits/qtr (annual) 4 4 4 4 Total Estimated Tuition Revenues $48,928 $310,344 $340,848 $340,848 $351,098 Assumes 3% tuition increase every other year Underestimates the number of students in the program at any time by 10%, just in case the original estimate was too optimistic
Example Enrollment Projection 26
Applied Baccalaureate Degrees at SBCTC www.sbctc.edu Questions?