

Project Management Wiley 2007 Learning Objectives Diagram networks of project activities Estimate the completion time of a project Compute the probability of completing a project by a specific time ID: 251500
Download Presentation The PPT/PDF document "© Wiley 2007" is the property of its rightful owner. Permission is granted to download and print the materials on this web site for personal, non-commercial use only, and to display it on your personal computer provided you do not modify the materials and that you retain all copyright notices contained in the materials. By downloading content from our website, you accept the terms of this agreement.


Slide1
© Wiley 2007
Project ManagementSlide2
© Wiley 2007
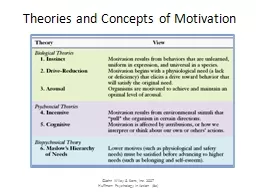
Learning Objectives
Diagram
networks of project
activities
Estimate the completion time of a
project
Compute the probability of completing a project by a specific timeSlide3
© Wiley 2007
Learning Objectives - continued
Determine how to reduce the length of a project
effectively
Describe the critical chain approach to project managementSlide4
© Wiley 2007
Network Planning Techniques
Program Evaluation & Review Technique (PERT):
Developed to manage the Polaris missile project
Many tasks pushed the boundaries of science & engineering (tasks’ duration = probabilistic)
Critical Path Method (CPM):
Developed to coordinate maintenance projects in the chemical industry
A complex undertaking, but individual tasks are routine (tasks’ duration = deterministic)Slide5
© Wiley 2007
Both PERT and CPM
Graphically display the precedence relationships & sequence of activities
Estimate the project’s duration
Identify critical activities that cannot be delayed without delaying the project
Estimate the amount of slack associated with non-critical activitiesSlide6
© Wiley 2007
Network Diagrams
Activity-on-Node (AON):
Uses nodes to represent the activity
Uses arrows to represent precedence relationshipsSlide7
© Wiley 2007
Step 1-Define the Project:
Cables By Us
is bringing a new product on line to be manufactured in their current facility in some existing space. The owners have identified 11 activities and their precedence relationships. Develop an AON for the project.Slide8
© Wiley 2007
Step 2- Diagram the Network for Cables By UsSlide9
© Wiley 2007
Step 3 (a)- Add Deterministic Time Estimates and Connected Paths Slide10
© Wiley 2007
Step 3 (a) (Continued)
: Calculate the Path Completion Times
The longest path (ABDEGIJK) limits the project’s duration (project cannot finish in less time than its longest path)
ABDEGIJK is the project’s
critical pathSlide11
© Wiley 2007
Some Network Definitions
All
activities
on the
critical path
have
zero slack
Slack
defines how long
non-critical
activities
can be
delayed
without delaying the project
Slack
= the activity’s
late finish minus its early finish
(or its
late start minus its early start
)
Earliest Start (
ES
) = the earliest finish of the immediately preceding activity
Earliest Finish (
EF
) = is the
ES plus
the
activity time
Latest Start (
LS
) and Latest Finish (
LF
) = the latest an activity can start (LS) or finish (LF) without delaying the project completionSlide12
© Wiley 2007
ES, EF Network Slide13
© Wiley 2007
LS, LF NetworkSlide14
© Wiley 2007
Calculating SlackSlide15
© Wiley 2007
Revisiting Cables By Us Using Probabilistic Time EstimatesSlide16
© Wiley 2007
Using Beta Probability Distribution to Calculate Expected Time Durations
A typical beta distribution is shown below, note that it has definite end points
The expected time for finishing each activity is a weighted averageSlide17
© Wiley 2007
Calculating Expected Task TimesSlide18
© Wiley 2007
Network Diagram with Expected Activity TimesSlide19
© Wiley 2007
Estimated Path Durations through the Network
ABDEGIJK
is the expected critical path & the project has an expected duration of
44.83 weeksSlide20
© Wiley 2007
Adding ES and EF to NetworkSlide21
© Wiley 2007
Gantt Chart Showing Each Activity Finished at the Earliest Possible Start DateSlide22
© Wiley 2007
Adding LS and LF to NetworkSlide23
© Wiley 2007
Gantt Chart Showing the Latest Possible Start Times if the Project Is to Be Completed in 44.83 WeeksSlide24
© Wiley 2007
Reducing Project Completion Time
Project completion times may need to be shortened because
Different deadlines
Penalty clauses
Need to put resources on a new project
Promised completion dates
Reduced project completion time is “crashing”Slide25
© Wiley 2007
Reducing Project Completion Time - continued
Crashing a project needs to balance
Shorten a project duration
Cost to shorten the project duration
Crashing a project requires you to know
Crash time of each activity
Crash cost of each activity
Crash cost/duration = (crash cost-normal cost)/(normal time – crash time)Slide26
© Wiley 2007
Reducing the Time of a Project (crashing)
Activity
Normal Time (wk)
Normal Cost ($)
Crash Time
Crash Cost ($)
Max. weeks of reduction
Reduce cost per week
A
4
8,000
3
11,000
1
3,000
B
6
30,000
5
35,000
1
5,000
C
3
6,000
3
6,000
0
0
D
6
24,000
4
28,000
2
2,000
E
14
60,000
12
72,000
2
6,000
F
5
5,000
4
6,500
1
1500
G
2
6,000
2
6,000
0
0
H
2
4,000
2
4,000
0
0
I
3
4,000
2
5,000
1
1,000
J
4
4,000
2
6,400
2
1,200
K
2
5,000
2
5,000
0
0Slide27
© Wiley 2007
Crashing Example: Suppose the Cables By Us
project manager wants to reduce the new product project from
41
to
36
weeks.
Crashing Costs are considered to be linear
Look to crash activities on the critical path
Crash the least expensive activities on the critical path first (based on cost per week)
Crash
activity I
from 3 weeks to 2 weeks
$1000
Crash
activity J
from 4 weeks to 2 weeks
$2400
Crash
activity D
from 6 weeks to 4 weeks
$4000
Recommend Crash Cost
$7400
Question: Will crashing
5 weeks
return more in benefits than it costs?Slide28
© Wiley 2007
Crashed Network Diagram Slide29
© Wiley 2007
The Critical Chain Approach
The
Critical Chain Approach
focuses on the project due date rather than on individual activities and the following realities:
Project time estimates are uncertain so we add safety time
Multi-levels of organization may add additional time to be “safe”
Individual activity buffers may be wasted on lower-priority activities
A better approach is to place the project safety buffer at the end
Original critical path
Activity A
Activity B
Activity C
Activity D
Activity E
Critical path with project buffer
Activity A
Activity B
Activity C
Activity D
Activity E
Project BufferSlide30
© Wiley 2007
Adding Feeder Buffers to Critical Chains
The theory of constraints, the basis for critical chains, focuses on keeping bottlenecks busy.
Time buffers can be put between bottlenecks in the critical path
These feeder buffers protect the critical path from delays in non-critical paths Slide31
© Wiley 2007
The End
Copyright © 2007 John Wiley & Sons, Inc. All rights reserved. Reproduction or translation of this work beyond that permitted in Section 117 of the 1976 United State Copyright Act without the express written permission of the copyright owner is unlawful. Request for further information should be addressed to the Permissions Department, John Wiley & Sons, Inc. The purchaser may make back-up copies for his/her own use only and not for distribution or resale. The Publisher assumes no responsibility for errors, omissions, or damages, caused by the use of these programs or from the use of the information contained herein.