
Mannix 20182019 Introduction Population genetics is the study of change in the frequencies of alleles within a population 1 allele comes from mom and the other from dad 2 alleles together is called the genotype ID: 918241
Download Presentation The PPT/PDF document "Population Genetics Life Science" is the property of its rightful owner. Permission is granted to download and print the materials on this web site for personal, non-commercial use only, and to display it on your personal computer provided you do not modify the materials and that you retain all copyright notices contained in the materials. By downloading content from our website, you accept the terms of this agreement.

Slide1
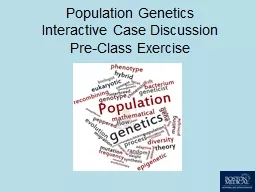
Population Genetics
Life Science
Mannix 2018-2019
Slide2Introduction
Population genetics is the study of change in the frequencies of alleles within a population.
1 allele comes from mom and the other from dad.
2 alleles together is called the genotype
The physical representation of the genotype is the phenotype.
Slide35 Factors that change Allele Frequency
Mutation rates
Migration in and out of an area
Genetic drift
Nonrandom mating
Natural selection
Slide4Mutations
Errors in DNA or RNA replication
Causes new variations!
Remember only variations that help out an organism (make them better suited to survive will continue to show up over and over again through the generations)
https://www.youtube.com/watch?v=GieZ3pk9YVo
Slide5Migration
Movement of individuals from one population to another.
Immigration: movement into a population
Ex: A flock of birds move into a new area for a certain season
Ex: Humans move to a country that is NOT where they are born.
Emigration: movement out of a population
Ex: When the flock of birds left their original living place.
Ex: Human leave the place they were born.
A huge influence to changes in allele frequencies.
Slide6Genetic Drift
RANDOM loss of alleles in a certain area.
Founder Effect: small group of individuals move away
Bottleneck Effect: a sudden decrease in population size due to some kind of natural disaster.
https://www.youtube.com/watch?v=W0TM4LQmoZY
Slide7Genetic Drift Examples
Does the below example represent the Founders effect or the Bottleneck effect? How do you know?
Afrikaner population of Dutch settlers in South Africa is descended mainly from a few colonists. Today, the Afrikaner population has an unusually high frequency of the gene that causes Huntington's disease, because those original Dutch colonists just happened to carry that gene with unusually high frequency.
Slide8Genetic Drift Examples
Does the below example represent the Founders effect or the Bottleneck effect? How do you know?
Northern elephant seals have reduced genetic variation probably because of a population bottleneck humans inflicted on them in the 1890s. Hunting reduced their population size to as few as 20 individuals at the end of the 19th century
Slide9Nonrandom Mating
Mating that occurs more or less frequently than expected (does not fit a regular
punnett
square)
Inbreeding: mating with relatives, increases homozygous recessive traits.
Out breeding: mating with non-relatives, increase
heterozygosity
. (MORE DIVERSE/BETTER!!)
Slide10Selection
Artificial Selection:
People influenced
We select traits for a desired outcome.
EX:
Labardoodle
or
Pomchi
Slide11Selection
Natural Selection: the environment selects for the traits that are best FIT to survive.
https://thekidshouldseethis.com/post/evolution-101-how-natural-selection-works-nova-pbs
Slide12Types of Natural Selection
Stabilizing
Extreme phenotypes are eliminated in a population.
Disruptive
Intermediate (middle) phenotypes are eliminated in a population.
Directional
A single extreme phenotype is eliminated in a population.
Slide13Stabilizing Selection
Favors the average individuals!
Slide14Stablilizing Selection
Slide15Disruptive Selection
Extreme traits are preferred
In the African seed-cracker finch, large and small beaked birds are more common because they are able to open the large and small seeds present in the population.
Slide16Disruptive Selection
Slide17Directional Selection
One particular phenotype is favored.
Fossil records show that black bears in Europe decreased in size during periods between continental glacial coverage during the ice ages, but increased in size during the glacial period. This was likely because larger individual enjoyed an advantage in conditions of limited food supplies and extreme cold.
Slide18Directional Selection