
in the Caribbean 2013 Drawing Line Graphs and Bar Charts line graph 2 Salmonella in the Caribbean 2013 Attributes of a Surveillance System Tips for Better FiguresFigures illustrate trends aberrat ID: 937272
Download Pdf The PPT/PDF document "Salmonella" is the property of its rightful owner. Permission is granted to download and print the materials on this web site for personal, non-commercial use only, and to display it on your personal computer provided you do not modify the materials and that you retain all copyright notices contained in the materials. By downloading content from our website, you accept the terms of this agreement.


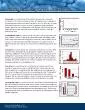
Salmonella in the Caribbean - 2013 Drawing Line Graphs and Bar Charts line graph 2 Salmonella in the Caribbean - 2013 Attributes of a Surveillance System Tips for Better FiguresFigures illustrate trends, aberrations, similarities, and differences in data at a glance. They are an ideal way to present data to others. Viewers remember key points from data presented in figures much better than they do through tables.In drawing any type of figure, several overarching principles should be followed. Figures should be easy to interpret. They should be simple and limited in the amount of information being conveyed. Figures should always be able to stand alone, meaning the viewer can interpret the information without further explanation. Adornment of figures, such as use of different fonts, multiple color, and threedimensional effects, should be limited and not distract the eye of the viewer or interfere with the reception of the intended message. Figures should be created to convey a message, but should not be manipulated to misrepresent the truth or add nonexistent drama, such as by using a scale inappropriate to the data or the juxtaposition of two unrelated series of data. Tips to achieve these principles are listed below. Every figure should have a title that describes its content, such as subject, person, place, and time.The source of the data should be clearly stated.The horizontal and vertical axes should be distinct from other lines on the figure and clearly labeled with units of measurement and variable names.If more than one series of data presented, eachshould be labeled and clearly distinguishable.No more than 24 series of data or 24 subcategories of a variable should be presented in one figure.Footnotes should be usedto explain codes, abbreviations, and symbols.Information that can give meaning to the figure's message, such as the timing of implementation of control measures, should be noted. Unnecessary information should not be included.The amount of text includedon the figure should be limited and readable.Adornment should belimited to features that help convey the figure’s message. 3 Salmonella in the Caribbean - 2013 Attributes of a Surveillance System Give it a try with the following exercise.EXERCISE Giardiasis is a gastrointestinal illness caused by the protozoal parasite, Giardia intestinalis. Giardiasis became a nationally notifiable disease in 2002. is figure represents laboratoryconfirmed giardiasis reported to the Centers for Disease Control and Prevention (CDCduring to 20Investigators are interested in examining trends in cases over time.Critique this figureWhat changes would make it better? 4 Salmonella in the Caribbean - 2013 Attributes of a Surveillance System Note: Use Shift+Ctrl+ Plus to rotate view Exercise Answer: Because the figure displays the relation between two continuous variables (time and number of cases), it is best presented as a line graph or histogram, not a bar c
hart.In addition, the yaxis (number of cases) should begin at ro, not 17,500. Starting the yaxis at 17,500 suggests that there is a bigger variation in case counts from year to year than actually existsIn additionThe figure should have a title that describes its content, such as subject, person, place, and time. The axes lines should be more prominent than other lineson the gaphThe label on the horizontal axis should indicate that the cases are presented by year of report.The number of labels included on the horizontal and vertical s should be limited to simplify the figure.The source of the data should be indicated in the title or a footnote.The following figure incorporates the above recommendations. Salmonella in the Caribbean - 2013 Drawing Line Graphs and Bar Charts line graphis a visual display of the relation between two continuous variables such as time and number of cases. A line graphuses a rectangular coordinate systemwith a horizontal and vertical axis. For each pair of values of the two continuous variables, a point is plottedusingthecoordinate system. The points are connected by a line. The best use of a line graph is to display trends in events over time such as numbers of cases or rates of a disease over time.multipleline graphis a special type of line graph in which more than one series of data is shown on the same coordinate system. The different data series share the same luesalong the horizontal axis, but can differ on the vertical axisThe best use of ultipleline graph to compare trends in different diseases over time or the same disease in different populations over time. histogramis a visual display of a continuous variable such as timeor date of illness onset. Rectangles of varying height are used to represent the frequencyof different values of the continuous variable. The heights of the rectangles are proportional to the number of observations thosevalues. There are no spaces between the rectangles. The best use of a histogram is to display the number of events over time, for example, the number of cases during an outbreak, as in an epidemic curve.bar chartis a visual display of a variable that can take on only a finite number of values (such as sex or race/ethnicity) or a continuous variable (such as age) that is presented as discrete categories (such as age groups). Each value or category of the variable is represented by a bar. The length of the bar is proportional to the number of observations for that value or category. The bars are separated by a space. The best use of a bar chart is to compare size or frequency of different values or categories of a variable.grouped bar chartis a special type of bar chart used to illustrate data from the crosstabulation of two variableswhich results in multiple subcategoriesThe subcategoriesof the variables are individually represented by bars on the same chartand are clustered together into meaningful groups. The best use of a grouped bar chart is to compare size or frequency of sub
categories within multiple categories. 4 Salmonella in the Caribbean - 2013 Attributes of a Surveillance System ote: Use Shift+Ctrl+ Plus to rotate view .nsotindaemmocer evoba thestearporonc ieurgfi ngiwoll foheT.teotnofo ar oetl tiethn idetacndi ibed ulho stada he tfo ecuro sheT.reuigf eh tyfliimp sot de limite blduoh ssal icrte vdn aaltnorizoh then d oudelnc isleba lf orbenum heT.rtop ref oarey d bytenese prer asesa chet tah tteacdin idulhos isal axtnozrioh eh tnol eab lehT .hapg en thoseinl rehotn that nneimopr erom bedulho ssnei lsex aheT .em tinda ,ecapl n,osre pt,cebju ssah uc snt,nteo cts isbeircs detha tetlti aevad huloh seurgfi heTnotididn aI .stsxie allyut acanhar te yor taem yro fstnuo ceasc n iniotaria vregig b a iserehtt aths tsgge su005,7 1ta siax yeth gnitrat S 00.5 17,ot no,rt n aigebd ulhos )seas cfr oembun (isax yhe tn,oitiddn aI.arthar cb a to nram,gotis hr ohrapge ni l as aedtenesr ptes bsit i,)sesa cf orbenumnd aemti( seblaira vusnuontioc two neetw benotiale r thesyapls dieurgfi he teusaceB:rewnsA isecrxeE 3 Salmonella in the Caribbean - 2013 Attributes of a Surveillance System Give it a try with the following exercise.EXERCISE Giardiasis is a gastrointestinal illness caused by the protozoal parasite, Giardia intestinalis. Giardiasis became a nationally notifiable disease in 2002. is figure represents laboratoryconfirmed giardiasis reported to the Centers for Disease Control and Prevention (CDC) during to 20Investigators are interested in examining trends in cases over time.Critique this figureWhat changes would make it better? 2 Salmonella in the Caribbean - 2013 Attributes of a Surveillance System Tips for Better FiguresFigures illustrate trends, aberrations, similarities, and differences in data at a glance. They are an ideal way to present data to others. Viewers remember key points from data presented in figures much better than they do through tables.In drawing any type of figure, several overarching principles should be followed. Figures should be easy to interpret. They should be simple and limited in the amount of information being conveyed. Figures should always be able to stand alone, meaning the viewer can interpret the information without further explanation. Adornment of figures, such as use of different fonts, multiple color, and threedimensional effects, should be limited and not distract the eye of the viewer or interfere with the reception of the intended message. Figures should be created to convey a message, but should not be manipulated to misrepresent the truth or add nonexistent drama, such as by using a scale inappropriate to the data or the juxtaposition of two unrelated series of data. Tips to achieve these principles are listed below. Every figure should have a title that describes its content, such as subject, person, place, and time.The source of the data should be clearly stated.The horizontal and vertical axes should be distinct from other
lines on the figure and clearly labeled with units of measurement and variable names.If more than one series of data presented, eachshould be labeled and clearly distinguishable.No more than 24 series of data or 24 subcategories of a variable should be presented in one figure.Footnotes should be usedto explain codes, abbreviations, and symbols.Information that can give meaning to the figure's message, such as the timing of implementation of control measures, should be noted. Unnecessary information should not be included.The amount of text includedon the figure should be limited and readable.Adornment should belimited to features that help convey the figure’s message. Salmonella in the Caribbean - 2013 Drawing Line Graphs and Bar Charts line graphis a visual display of the relation between two continuous variables such as time and number of cases. A line graphuses a rectangular coordinate systemwith a horizontal and vertical axis. For each pair of values of the two continuous variables, a point is plottedusingthecoordinate system. The points are connected by a line. The best use of a line graph is to display trends in events over time such as numbers of cases or rates of a disease over time.multipleline graphis a special type of line graph in which more than one series of data is shown on the same coordinate system. The different data series share the same luesalong the horizontal axis, but can differ on the vertical axisThe best use of ultipleline graph to compare trends in different diseases over time or the same disease in different populations over time. histogramis a visual display of a continuous variable such as timeor date of illness onset. Rectangles of varying height are used to represent the frequencyof different values of the continuous variable. The heights of the rectangles are proportional to the number of observations thosevalues. There are no spaces between the rectangles. The best use of a histogram is to display the number of events over time, for example, the number of cases during an outbreak, as in an epidemic curve.bar chartis a visual display of a variable that can take on only a finite number of values (such as sex or race/ethnicity) or a continuous variable (such as age) that is presented as discrete categories (such as age groups). Each value or category of the variable is represented by a bar. The length of the bar is proportional to the number of observations for that value or category. The bars are separated by a space. The best use of a bar chart is to compare size or frequency of different values or categories of a variable.grouped bar chartis a special type of bar chart used to illustrate data from the crosstabulation of two variableswhich results in multiple subcategoriesThe subcategoriesof the variables are individually represented by bars on the same chartand are clustered together into meaningful groups. The best use of a grouped bar chart is to compare size or frequency of subcategories within multiple categories