
Sampling error is acknowledgedClaimsInferences indicate that a sample may or may not be representative of the larger population Interpretations include the difference between two groups with differe ID: 863873
Download Pdf The PPT/PDF document "Students are designing for group differe..." is the property of its rightful owner. Permission is granted to download and print the materials on this web site for personal, non-commercial use only, and to display it on your personal computer provided you do not modify the materials and that you retain all copyright notices contained in the materials. By downloading content from our website, you accept the terms of this agreement.


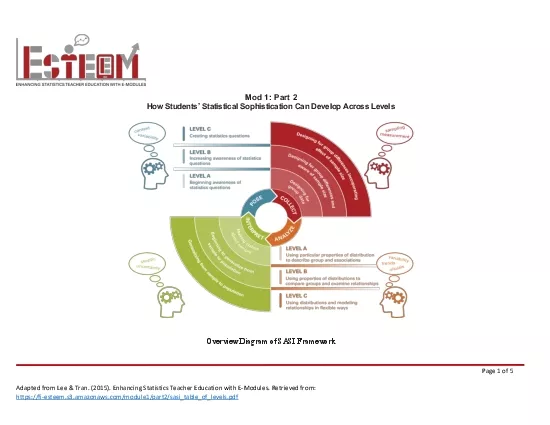
1 Students are designing for group differe
Students are designing for group differences and aware of sample size. Sample surveys are conducted in which students begin to use random selection. Data is collected from comparative experiments that begin to account for random assignment. Sample size is considered when designing data collection. Students are designing for group differences and incorporating effect of sampl Sampling error is acknowledged. Claims/Inferences indicate that
2 a sample may or may not be representati
a sample may or may not be representative of the larger population. !Interpretations include the difference between two groups with different conditions. !Basic measure of strength of association and models for association among variables are provided and interpreted.Interpretations begin to distinguish between association and cause and effect. !Interpretations demonstrate awareness of the distinction between observational studies and expe
3 riments. !Students are using data to ma
riments. !Students are using data to make inferences to a population. !Inferences include generalizations from sample to population that account for expected variation. !Interpretations indicate role of sample size and the effect of random assignment on the results of experiments. !Measures of strength of association and Franklin, C., Kader, G., Mewborn, D., Moreno, J., Peck, R., Perry, M., & Scheaffer, R. (2007). Guidelines for assessment
4 and instruction in statistics education
and instruction in statistics education (GAISE) report. American Statistical Association. Online at http://www.amstat.org/education/gaise/. Friel, S.N., O'Connor, W., & Mamer, J.D. (2006). More than ÒMeanmedianmodeÓ and a bar graph: What's needed to have a statistical conversation. In G. F. Burrill (Ed.), Thinking and reasoning with data and chance (pp. 117-137). National Council of Teachers of Mathematics. Garfield, J., Aliaga, M., Cobb, G
5 ., Cuff, C., Gould, R., Lock, R., ... &
., Cuff, C., Gould, R., Lock, R., ... & Witmer, J. (2005). Guidelines for assessment and instruction in statistics education (GAISE): College report. Alexandria, Virginia: The American Statistical Association. Konold, C., & Higgins, T. L. (2003). Reasoning about data. In J. Kilpatrick, W. G. Martin, & D. Schifter (Eds.), A research companion to Principles and Standards for School Mathematics (pp. 193Ð215). Reston, VA: National Council of Teac