

Gene Declercq PhD Boston University School of Public Health July 2021 wwwbirthbythenumbersorg Outline of the Presentation Clarifying Definitions Historical Context The Strange Case of the Pregnancy Checkbox ID: 919550
Download Presentation The PPT/PDF document "The Contemporary Challenge of Maternal M..." is the property of its rightful owner. Permission is granted to download and print the materials on this web site for personal, non-commercial use only, and to display it on your personal computer provided you do not modify the materials and that you retain all copyright notices contained in the materials. By downloading content from our website, you accept the terms of this agreement.


Slide1
The Contemporary Challenge of Maternal Mortality in the U.S.
Gene Declercq, PhD
Boston University School of Public Health
July, 2021
www.birthbythenumbers.org
Slide2Outline of the Presentation
Clarifying Definitions
Historical Context
The Strange Case of the Pregnancy CheckboxThe Pregnancy Mortality Surveillance SystemComparing the U.S. to the Rest of the WorldThe Persistence of Racial Disparities7. Timing and Maternal Mortality a Public Health Problem8. The Issue is Broader than Maternal Mortality9. The Way Forward
www.birthbythenumbers.org
Slide31. Definitions – the multiple measures of maternal death
www.birthbythenumbers.org
Slide4First a quick side trip into the terms rate and ratio. If you don’t find that discussion enthralling you:
(a) are a normal human being; and
(b) can skip to slide 11 and wonder what you missed.
www.birthbythenumbers.org
Slide5Is Maternal Mortality a Ratio or a Rate?
WHO reports maternal mortality as a
ratio
, while the U.S. National Vital Statistics System reports maternal mortality as a rate. What’s the difference?Maternal Mortality Ratio: Deaths during pregnancy up to 42 days ppm Live BirthsIt is a ratio because all the cases in the numerator (e.g. death during early pregnancy) are not included in the denominator.
www.birthbythenumbers.org
Slide6Source: Hoyert DL. Maternal mortality rates in the United States, 2019. NCHS Health E-Stats. 2021.
DOI: https://doi.org/10.15620/cdc:103855.
www.birthbythenumbers.org
Slide7Source: WHO. Trends in Maternal Mortality. WHO, 2019.
www.birthbythenumbers.org
Slide8Is Maternal Mortality a Ratio or a Rate?
Rate:
# of events / total persons at risk in the population (usually % or number per 1,000/100,000)
Ratio: # of events (or persons) / some comparable cohort of people or eventswww.birthbythenumbers.org
Slide9Is Maternal Mortality a Ratio or a Rate?
RATE
:
The frequency of an event in a population. All the cases in the numerator are included in the denominatorExample: Births to women 15-19 Teen Birth Rate All women 15-19 RATIO: simply divides one number by another – all the cases in the numerator are not included in the denominatorExample: Maternal Deaths Maternal Mortality Ratio Live Births
www.birthbythenumbers.org
Slide10So, why do we use maternal mortality ratios internationally?
Because most countries don’t have clear measurement of the total number of pregnancies, but do have some
record of total births.
www.birthbythenumbers.org
Slide11The three widely used definitions of maternal mortality:1. Pregnancy associated death
2. Pregnancy related death
3 Maternal mortality
www.birthbythenumbers.org
Slide12Three Definitions (in the U.S.)
Pregnancy Associated Death
– The death of a women while pregnant or
within one year of termination of pregnancy, irrespective of cause. (WHO calls these “pregnancy related”). Starting point for analyses. Maternal Mortality Ratio – the death of a woman while pregnant or within 42 days of termination of pregnancy, irrespective of the duration and site of the pregnancy, from any cause related to or aggravated by the pregnancy or its management but not from accidental or incidental causes. Typically reported as a ratio per 100,000 births. Used in international comparisons.
Pregnancy Related Death
– the death of a woman during pregnancy or
within one year
of the end of pregnancy from a pregnancy complication, a chain of events initiated by pregnancy, or the aggravation of an unrelated condition by the physiologic effects of pregnancy.
Used by CDC for U.S. trends.
www.birthbythenumbers.org
Slide13Pregnancy Associated Mortality
(1 year)
www.birthbythenumbers.org
Pregnancy Associated Mortality:
All Deaths women of
reprod
. age
pregnancy to 1 year ppm
Slide14Pregnancy Related Mortality
(1 year)
Pregnancy Associated Mortality
(1 year)
www.birthbythenumbers.org
Pregnancy Related Mortality:
All Deaths women of
reprod
. age
pregnancy to
1 year ppm
Related to the pregnancy
Slide15Maternal Mortality (42 days)
Pregnancy Related Mortality
(1 year)
Pregnancy Associated Mortality
(1 year)
Maternal
Mortality:
All Deaths women of
reprod
. age
pregnancy to
42 days ppm Related to the pregnancy
www.birthbythenumbers.org
Slide16Maternal Mortality (42 days)
Pregnancy Related Mortality
(1 year)
Pregnancy Associated Mortality
(1 year)
www.birthbythenumbers.org
Pregnancy Associated Mortality:
D
eaths during pregnancy and up to
1 year postpartum
Pregnancy Related Mortality:
Deaths during pregnancy and up to
1 year postpartum
& related to the pregnancy
Maternal Mortality:
Deaths during pregnancy and up to
42 days postpartum
& related to the pregnancy
Slide17Timeline of Maternal Mortality Definitions
Pregnancy
Birth
42 days PPM to 1 year
Week
after
Birth
42 days
PPM
PPM – postpartum –period after the birth
WHO Definition of Maternal Death
WHO Maternal Mortality
CDC Pregnancy Related
Pregnancy Associated
www.birthbythenumbers.org
Slide182. The Historical Trend in U.S. Maternal Mortality
www.birthbythenumbers.org
Slide19Declaring Premature Victory
“
An examination of the rates for the different states indicates areas in which further improvement can be expected, but it is clear that maternal mortality is no longer a nationwide problem……Childbearing has been made quite safe.”
Maternal Deaths One in a Thousand. JAMA, 1950; 144: 1096-7. At the time the maternal mortality rate was 100 per 100,000www.birthbythenumbers.org
Slide20U.S. Maternal Mortality (per 100,000 births), 1915-2019
Sources: NCHS. Maternal Mortality and Related Concepts. Vital & Health Statistics. Series 33; #3. & annual data reports. 1915-1960 data from NCHS.
Vital Statistics Rates In The United States 1940-1960
. NOTE: Shifts in measurement (e.g. not all states were part of registration system prior to 1933) accounts for some of the variation over time. 2007-2016 based on 2 year estimates of the pregnancy related mortality rate: Petersen E. MMWR.9/6/19; 2017: Rossen. Impact of Pregnancy Checkbox, U.S. 1999-2017.NCHS.VitalHlthStat.3(44);2020.; 2018: U.S. Hoyert DL etal. NVSR; vol 69 no 2. Hyattsville, MD: NCHS. 1/30/2020.
www.birthbythenumbers.org
Slide21Year State was Added to the Death Registry
www.birthbythenumbers.org
Slide22Number of U.S. Hospital Beds and Maternal Mortality, 1918-1950
Hospital Beds
Sources: Hospital beds- Statistical Abstract & JAMA: Maternal mortality - NCHS.
Vital Statistics Rates In The United States 1940-1960.
Slide23U.S. Maternal Mortality (per 100,000 live births), 1951-2007
1951-1982
89% decline (75.0 to 7.9)
Source: NCHS. Deaths: Final Data. Annual Reports.
www.birthbythenumbers.org
Slide24U.S. Maternal Mortality (per 100,000 live births), 1951-2007
1982-1998
Basically no change
7.9 to 7.1
Source: NCHS. Deaths: Final Data. Annual Reports.
www.birthbythenumbers.org
Slide25U.S. Maternal Mortality (per 100,000 live births), 1951-2007
1997-2007
78% increase (7.1 to 12.7)
Source: NCHS. Deaths: Final Data. Annual Reports.
www.birthbythenumbers.org
Slide26U.S. Maternal Mortality Ratio (per 100,000 live births) , 1951-2007
Why did reporting of an
official maternal
mortality ratio for U.S. stop in 2007?
www.birthbythenumbers.org
Slide27Last reporting (2007)of a maternal mortality rate by NCHS
www.birthbythenumbers.org
Slide28How did the U.S. get to the point where they stopped publishing a maternal mortality rate?
Efforts to avoid poor case ascertainment led to over-ascertainment
www.birthbythenumbers.org
Slide293. The Case of the Pregnancy Checkbox
“This difficulty [in measuring maternal mortality] would be solved easily if universal birth and stillbirth registration was practiced and if death certificates required a statement as to the association of the puerperal state.”
www.birthbythenumbers.org
Slide303. The Case of the Pregnancy Checkbox
“This difficulty [in measuring maternal mortality] would be solved easily if universal birth and stillbirth registration was practiced and if death certificates required a statement as to the association of the puerperal state.”
Committee on Maternal Welfare. Maternal Mortality in Philadelphia 1931-1933 (1934)
www.birthbythenumbers.org
Slide31Quick note on the federal reporting system of births and deaths.
There is no centralized “national” reporting system in the U.S.
Birth and death data is collected at the local level, compiled at the state level, and then selected items are sent to the National Vital Statistics System (NVSS).
The states and the NVSS periodically negotiate an agreement (seen in the U.S. Standard Certificate of Death) on the specific items from state data collection used in the national file. These revisions were last made in 1975,1989, and 2003. The failure to officially report U.S. maternal deaths from 2008-18 was a direct result of the 2003 revisions that attempted to improve reporting. www.birthbythenumbers.org
Slide32Am J
Prev
Med
2000;19(1S):35-39.
16 States already had a checkbox as far back as 1991-1992, but with different wording
www.birthbythenumbers.org
Slide33State
Wording
Alabama
Was there a pregnancy in last 42 days? (Specify Yes, No, or dk.)
California
If female, pregnant in last year? □ Yes □ No □ UNK
Florida
If female, was there a pregnancy in the past 3 months? Yes No
Idaho
If female aged 0–54: □ not
preg
win past yr □
preg
at time of death □ not pregnant, but
preg
within 42 days of death □ not pregnant but
preg
43 days to 1 yr before death □ unknown if
preg
w/in the past yr
Illinois
If female, was there a pregnancy in past three months? Yes □ No □
Indiana
Was decedent pregnant or 90 days postpartum? (Yes or no)
Iowa
If female, was there a pregnancy in the past 12 months? (Specify yes or no)
Kentucky
If female, was there a pregnancy in the past 12 months? □ Yes □ No
Louisiana
If deceased was female 10–49, was she pregnant in the last 90 days? □ Yes □ No □
Unk
Maryland
If female: Was decedent pregnant in the past 12 months? □ Yes □ No □ Unknown Separate field on dates of death and delivery support capability to compute the other categories in the standard.
Minnesota
Was female pregnant: At death? yes no In last 12 months? yes no unknown
Mississippi
Had decedent been pregnant within 90 days prior to death? □ Yes □ No
Missouri
If deceased was female 10–49, was she pregnant in the last 90 days?
□ Yes □ No □ Un
Montana
If female:
□ not
preg
within past year □ not
preg
but
preg
within
42 days of death □ not
preg
but pregnant 43 days to 1 year before death □ pregnant at time of death □ unknown if
preg
within past year
New Jersey
If female, was she pregnant at death, or any time 90 days prior to death
□ Yes □ No
New Mexico
Was decedent pregnant within last 6 weeks? □ Yes □ No
North Dakota
Was deceased pregnant within 18 months of death? □ Yes □ No
Nebraska
If female, was there a pregnancy in the past 3 months? Yes □ No □
Texas
Was decedent pregnant
at time of death □ yes □ no □ UNK within last 12 MO □ yes □ no □ UN
Virginia
If female, was there a pregnancy in past 3 months? Yes □ No □
Unknown □
Wording of “Pregnancy Checkbox” in states prior to 2003
Time periods used:
42 days;
6 weeks;
3 months;
90 days;
12
mos
;
“last year”
Source:
Hoyert
DL,
NVSR
;
vol
69 no 1. Hyattsville, MD: NCHS. 2020.
www.birthbythenumbers.org
Slide34Revised (2003) U.S. Standard
Certificate of Death
www.birthbythenumbers.org
Slide35To improve case identification:
U.S. Standard Pregnancy Question, 2003 (sort of)
Checkbox format:
IF FEMALE:Not pregnant within past yearPregnant at time of deathNot pregnant, but pregnant within 42 days of deathNot pregnant, but pregnant 43 days to 1 year before deathUnknown if pregnant within the past year
Meant to solve 2 problems:
Most states had no such question; and
Different questions used in different states that did ask about pregnancy status.
www.birthbythenumbers.org
Slide36Delays in Adoption of the U.S. Standard Pregnancy Question among States
*
Note: Some states adopted change in the middle of the calendar year.
New Adopters*
Total
2003
4
4
2004
7
11
2005
7
18
2006
4
22
2007
2
24
2008
7
31
2009
0
31
2010
4
35
2011
2
37
2012
4
41
2013
1
42
2014
5
47
2015
2
49
2016
1
50
2017
1
51
CA, ID, MT, NY
2003
New Jersey
2004
Florida
2005
Texas
2006
Ohio
2007
Massachusetts
9/2014
Alabama
2016
W. VA
2017
www.birthbythenumbers.org
Slide37Source: Ventura SJ. The U.S. National Vital Statistics System: Transitioning into the 21st century, 1990–2017. National Center for Health Statistics. Vital Health Stat 1(62). 2018.
www.birthbythenumbers.org
Slide38Maternal Mortality Rates
(per 100,000)
in States
with & without a checkbox, 1996-2003So adopting the checkbox will solve the problem of under ascertainment & we can report a more accurate national rate after 2003? Source: Hoyert DL.
Maternal mortality and related concepts
. National Center for Health Statistics. Vital Health Stat 3(33). 2007
.
www.birthbythenumbers.org
Slide39www.birthbythenumbers.org
Slide40Correcting for Impact of Adding Pregnancy Box
Also did tests involving 1 year and 3 year periods with little change
www.birthbythenumbers.org
Slide41Note: Includes 24 states that did not have a pregnancy question on their unrevised death certificate and which adopted the U.S. standard question upon revision: Arkansas, Arizona, Connecticut, Delaware, Georgia, Idaho, Kansas, Maine, Michigan, Montana, New Hampshire, Nevada, Ohio, Oklahoma, Oregon, Pennsylvania, Rhode Island, South Carolina, South Dakota, Tennessee, Utah, Vermont, Washington, and Wyoming.
States that had no question & added the checkbox
Impact of adding the pregnancy checkbox was to approximately double a state’s maternal mortality rate
www.birthbythenumbers.org
Correction Factor: 1.93
Slide42NVSS analyses of the checkbox
www.birthbythenumbers.org
Slide43Statistical Analysis
Objective 1: Quantify the impact of the staggered implementation of the pregnancy checkbox on MMRs
Objective 2: Estimate trends in MMRs from 1999 through 2017, accounting for the checkbox
Objective 3: Examine the impact of potential misclassification of pregnancy status on the death certificate on MMR trends from 1999 through 2017 www.birthbythenumbers.org
Slide44NCHS Analysis of the Impact of Checkbox
Source:
Rossen
LM, etal. The impact of the pregnancy checkbox, 1999–2017. NCHS. Vital Health Stat 3(44). 2020.
www.birthbythenumbers.org
Slide45Source: Rossen LM,
etal
.
The impact of the pregnancy checkbox, 1999–2017. NCHS. Vital Health Stat 3(44). 2020. Average change in maternal mortality rates associated with the pregnancy checkbox implementation, by state of occurrence: U. S., 2003–17
www.birthbythenumbers.org
Slide46Observed and predicted maternal mortality rates: United States, 1999–2017
Maternal Mortality Rate
Without Checkbox
Source:
Rossen
LM,
etal
.
The impact of the pregnancy checkbox, 1999–2017
. NCHS. Vital Health Stat 3(44). 2020.
4
11
18
22
24
31
31
35
37
41
42
47
49
50
51
2003
2004
2005
2006
2007
2008
2009
2010
2011
2012
2013
2014
2015
2016
2017
States with Checkbox
www.birthbythenumbers.org
Slide47Ratio of maternal deaths assigned using the checkbox item to maternal deaths assigned without using the checkbox item for maternal deaths: Selected states, 2015–2016
Source:
Hoyert
Dlet al. Evaluation of the pregnancy status checkbox on identification of maternal deaths. Nat’l Vital Stat Rep; V 69 # 1. Hyattsville, MD: NCHS. 2020. Number of deaths
State
Assigned by checkbox
Assigned w/out checkbox
Ratio
47 States & D.C.*
1,527
498
3.07
Florida
78
37
2.11
Georgia
134
28
4.79
Illinois
40
21
1.90
New York
72
41
1.76
Ohio
53
24
2.21
Texas
264
58
4.55
* Excludes Alabama, California, & W. Virginia
www.birthbythenumbers.org
Slide48Two key problems raised by the checkbox
1. Over ascertainment
2 Loss of precision in identifying causes of maternal death – the rise of “other” causes.
www.birthbythenumbers.org
Slide49The problem with “other”
Obstet
Gynecol 2017;129:811–8www.birthbythenumbers.orgSource:
MacDormanM
. Trends in Mat. Mort. By Socioeconomic Characteristics. OBGYN.2017;129:811
Slide50Underlying cause of death
Total maternal deaths (during pregnancy or within 42 days after the end of pregnancy) (
A34
, O00-O95, O98-O99)Total direct obstetric causes (A34, O00-O92)
Pregnancy with abortive outcome (O00-O07)
Ectopic pregnancy (O00)
Hypertensive disorders (O10-O16)
Pre-existing hypertension (O10)
Eclampsia and pre-eclampsia (O11,O13-O16)
Obstetric Hemorrhage (O20,O43.2,O44-O46,O67,O71.0-O71.1, O71.3-O71.4,O71.7,O72)
Pregnancy-related infection (O23,O41.1,O75.3,O85,O86,O91)
Puerperal sepsis (
O85
)
Other obstetric complications
(O21-O22,O24-O28,O30-O41.0, O41.8-O43.1, O43.8-O43.9,O47--O66,O68-O70,O71.2, O71.5, O71.6, O71.8, O71.9,O73,O75.0-O75.2,O75.4-O75.9,O87-O90,O92)
Diabetes mellitus in pregnancy (O24)
Liver disorders in pregnancy (
O26.6
)
Other specified pregnancy-related conditions (
O26.8
)
Obstetric embolism (
O88
)
Cardiomyopathy in the puerperium (
O90.3
)
Anesthesia-related complications (O29,O74,O89)
Total indirect causes
(O98-O99)
Mental disorders and diseases of the nervous system (
O99.3
)
Diseases of the circulatory system (
O99.4
)
Diseases of the respiratory system (
O99.5
)
Other specified diseases and conditions (
O99.8
)
Obstetric death of unspecified cause (
O95
)
Late maternal causes
(43 days-1 year after the end of pregnancy) (O96-O97)
Maternal Death ICD-10 Codes
www.birthbythenumbers.org
Source:
MacDormanM
.
OBGYN
.2017;129:811
Slide51Over Ascertainment??
Research into the cause of death category finds much of the increase is coming from
less specific ICD-10 codes
. Other specified pregnancy-related conditions (O26.8)Other obstetric complications (O21–O22, O24– O41.0, O41.8–O43.1, O43.8–O43.9,O47–O66, O68–O70,
O71.2
, O71.5,O71.6,
O71.8
,
O71.9
,
O73
–O75.2,O75.4–
O75.9
,
O87
–
O90
,
O92
)
Other specified diseases and conditions (
O99.8
)
Obstetric death of unspecified cause (
O95
)
www.birthbythenumbers.org
Source:
MacDormanM
.
OBGYN
.2017;129:811
Slide52Impact of ill-defined causes on maternal deaths by cause of death, 27 states & DC, 2008-2009 to 2013-2014
2008-9
2013-14
% ChangeUnderlying Cause of DeathRate
Rate
2008/9-2013/’14
Total Maternal
20.6
25.4
23.3
Ill-defined ”other” causes
7.0
10.4
47.9
Total maternal minus ill defined
13.5
15.0
10.6
Total Direct Obstetric
13.9
16.6
19.7
Other specified pregnancy related cond.
3.4
5.9
73.0
Total direct obstetric minus ill defined
10.5
10.7
2.3
Total indirect causes
5.3
8.2
54.4
Other
specified diseases & conditions
2.2
3.9
75.9
Total indirect minus ill defined
3.1
4.3
38.7
www.birthbythenumbers.org
Source:
MacDormanM
.
OBGYN
.2017;129:811
Slide53Ratios of deaths classified using pregnancy status checkbox to those classified without using the checkbox by Cause of Death, 47 states & D.C., 2015–2016
Source:
Hoyert
DL, etal. Evaluation of the pregnancy status checkbox on the identification of maternal deaths. NVSR; vol 69 no 1. Hyattsville, MD: NCHS. 2020.
www.birthbythenumbers.org
Slide54What of there were random error?
Impact of Random Error in Checking the Pregnancy Checkbox
Female Deaths
# Maternal Deaths
w/ 1% False Positives
# Maternal Deaths
Natural Causes
Total
907
82,572
<40
618
15,553
774
15–19
26
929
35
20–24
119
1,619
135
25–29
152
2,568
178
30–34
177
4,092
218
35–39
144
6,345
207
40–54
289
67,019
959
Source:
MacDormanM
.
Obstet
Gynecol
2017;129:811–8
www.birthbythenumbers.org
Slide55Impact of a 1% Random Coding Error on Maternal Mortality Rates
%
Source:
MacDormanM. Obstet Gynecol 2017;129:811–8
www.birthbythenumbers.org
Slide56Observed & predicted maternal mortality ratios, adjusted for a 1% error rate in the pregnancy checkbox: U. S., 1999–2017
Source:
Rossen
LM, etal. The impact of the pregnancy checkbox, 1999–2017. NCHS. Vital Health Stat 3(44). 2020.
Slide57Number of births and deaths with positive pregnancy responses in the checkbox: United States, 2013
Age
Births
Deaths
40-44
134,540
145
45-49
10,329
89
50-54
780
148
55-59
74
33
60-64
7
51
65-69
45
70-74
51
75-79
46
80-84
42
85+
147
NOTE: Alabama, Alaska, Colorado, Hawaii, Massachusetts, North Carolina, Virginia, and West Virginia did not have the standard checkbox in 2013.
Source:
Hoyert
&
Miniño
.
Maternal mortality in the United States, 2018
. NVSR;
vol
69 no 2. Hyattsville, MD: NCHS. 2020
331 cases of positive pregnancy checkbox in deaths of women 65+
www.birthbythenumbers.org
Slide58How can there be so much misclassification?
Who completes death certificates?
Death certificates can be signed by
a medical examiner, a primary physician, an attending physician, a non-attending physician, a nurse practitioner, a forensic pathologist or a coroner, but it varies according to state law. In Texas, for example, a justice of the peace can sign. Typically, deaths have to be recorded with local health departments within 72 hours of the death, and to the state within five to seven days.Only about 8% of death certifications involve an autopsyPBS. Frontline. PostMortem.(2/1/2011) https://www.pbs.org/wgbh/pages/frontline/post-mortem/things-to-know/death-certificates.html
www.birthbythenumbers.org
Slide59Over-ascertainment: Results of a 4 state study (Georgia, Louisiana, Michigan, and Ohio)
Source: A.
Daymude
. Checking the pregnancy checkbox: Evaluation of a four‐state quality assurance pilot. Birth
2019 online & Catalano A.
Validity of the Pregnancy Checkbox. AJOG.2019.online.
In 28% of cases with pregnancy checkbox checked, reviewers were not certain the woman was pregnant
www.birthbythenumbers.org
Slide60False Positives on the Pregnancy Checkbox by Age
Source: Adapted from Catalano A.
Validity of the Pregnancy Checkbox.
AJOG.2019.online.
www.birthbythenumbers.org
Slide61Impact of the Checkbox – Better and Worse Ascertainment
While the checkbox contributed to errors, the Four Committee data show that the
checkbox also improved identification of pregnancy-related deaths
. Without the pregnancy checkbox, approximately: 50% of pregnancy-related deaths that occurred during pregnancy 11% of pregnancy-related deaths that occurred within 42 days of the end of pregnancy, and 8% of pregnancy-related deaths that occurred within 43 days to 1 year of the end of pregnancy would have been missed.
Source: CDC.
Report from MMRCs: a view into their critical role.
www.birthbythenumbers.org
Slide62Summary
The introduction of the pregnancy checkbox served it’s stated purpose – it identified cases that would have been otherwise missed.
Unfortunately, it also led to a significant overcounting of women’s death as maternal deaths.
Even if you take a more conservative approach to determining the maternal mortality ratio, the U.S. data suggests we are not doing well. www.birthbythenumbers.org
Slide634.
The Pregnancy Related Mortality
Surveillance System
www.birthbythenumbers.org
Slide64Pregnancy Mortality Surveillance System
Slide65Data for CDCs Pregnancy Related Mortality System
Each year, CDC requests the 52 reporting areas (50 states, New York City, and Washington DC) to
voluntarily send copies of death certificates for all women who died during pregnancy or within 1 year of pregnancy, and copies of the matching birth or fetal death certificates,
if they have the ability to perform such record links. All of the information obtained is summarized, and medically trained epidemiologists determine the cause and time of death related to the pregnancy. Causes of death are coded by using a system established in 1986 by the American College of Obstetricians and Gynecologists and the Centers for Disease Control and Prevention Maternal Mortality Study Group.www.birthbythenumbers.org
Slide66Our best existing measure
Pregnancy Related Mortality, U.S., 1987-2017
Pregnancy Related Mortality Ratio (per 100,000 births)
Source: CDC. Adapted from
Creanga. Pregnancy-Related Mortality in the United States.
Obstet
Gynecol
2017 &
Petersen E. et al. Vital Signs: Pregnancy-Related Deaths, U.S., 2011–2015,.
MMWR
.
vol.68. May 7, 2019. 1-7 & Petersen E et al. Racial/Ethnic Disparities in Pregnancy Related Deaths – U.S. 2007-’16.
MMWR
9/6/19.
www.birthbythenumbers.org
Slide67Timing of Maternal Deaths
If a proportion of the pregnancy related deaths occur at 42+ days, then the maternal mortality ratio can be estimated using the pregnancy related mortality rate.
Source: Petersen E. et al. Vital Signs: Pregnancy-Related Deaths, United States, 2011–2015, and Strategies for Prevention, 13 States, 2013–2017.
MMWR .
vol.68. May 7, 2019. 1-7.
www.birthbythenumbers.org
Slide68Slide69Maternal Mortality Ratios (per 100,000 live births), U.S. 1987-2019*
Official NVSS Rate
Estimated from PMSS
#
1987-2007 & 2018-19 based on official NVSS reported ratio; 2008-2016 estimated based on Pregnancy-Related Mortality Ratio limited to 42 days postpartum
.
Source:
Adapted from: Callaghan W. https://www.cdc.gov/grand-rounds/pp/2017/20171114-presentation-maternal-mortality-H.pdf
# 2018-19 Official Ratios
www.birthbythenumbers.org
#
Slide70So is the maternal mortality going up in the U.S.?
Maternal Mortality Ratios (per 100,000 live births), U.S. 2009-2016
* 1987-2007 based on official NVSS reported ratio; 2008-2016 estimated based on Pregnancy-Related Mortality Ratio limited to 42 days postpartum
Estimated NVSS Rate w/ Checkbox
Estimated from PMSS
Source:
Hoyert
DL
etal
. Maternal mortality in the United States: Changes in coding, publication, and data release, 2018. National Vital Statistics Reports;
vol
69 no 2. Hyattsville, MD: National Center for Health Statistics. 2020.
www.birthbythenumbers.org
Slide71Summary
The Pregnancy Related Maternal Mortality System provides a reasonable alternative to the National Vital Statistics System and it has documented a steady increase in maternal deaths from 1987 to 2009.
It has also shown a plateauing of the ratio from 2008-2017.
The question is whether that plateauing is at an acceptable level and for that we need to place the U.S. in a comparative context. www.birthbythenumbers.org
Slide725. Comparing the U.S. to the Rest of the World
www.birthbythenumbers.org
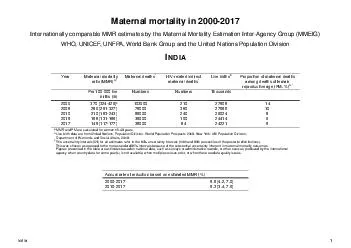
Slide73U.S. in a Comparative Context, 1910, 1927, 2017
1901-1910
1
1927
2
2017-19
3
per 100K births
per 100K births
per 100K births
Norway
290
245
2
Italy
270
264
2
Sweden
230
278
4
Northern Ireland
550
480
5
Australia
530
592
6
England & Wales
4
410
411
7
France
520
287
8
New Zealand
460
491
9
United States
5
650
647
20
Sources & Notes:
1. Meigs.
Maternal Mortality in U.S. & other countries
. 1917;
2.
Tandy.
Comparability of Maternal Mortality Rates in the United States and Certain Foreign Countries.
1933;
3.
WHO.
Trends in Maternal Mortality, 2000-2017;
4.
UK rate in 2017;
5.
Based on 10 reporting areas (CT,ME,MA,MI,NH,PN,RI,VT,NYC, DC) in 1910 & about 90% of all births in 1927.
www.birthbythenumbers.org
Slide74Maternal Mortality Ratios (per 100,000 births), 2017-19
Countries in green have fewer than 100,000 births.
Let’s do a more reasonable comparison
Source: WHO.
Trends In Maternal Mortality, 2000-2017
. (Geneva, 2019)
www.birthbythenumbers.org
Slide75U.S. Maternal Mortality Ratio (
per 100,000 births )
Compared to Industrialized Countries with 300,000+ births, 2018-19Source: OECD Health Data 2021 & U.S. Hoyert DL etal. National Vital Statistics Reports; vol 69 no 2. Hyattsville, MD: NCHS. 1/30/2020.
www.birthbythenumbers.org
Slide76U.S. Maternal Mortality Ratio (
per 100,000 births )
Compared to Industrialized Countries with 300,000+ births, 2018-19Source: OECD Health Data 2021 & U.S. Hoyert DL etal. National Vital Statistics Reports; vol 69 no 2. Hyattsville, MD: NCHS. 1/30/2020.
www.birthbythenumbers.org
Slide77OECD
8
% Decrease
*
Countries with
300,000
+ births (2017): Australia, Canada, France, Germany, Italy, Japan, S. Korea, Spain, United Kingdom
Sources: OECD Health Data 2021;
& U.S. Estimated from NVSS & Pregnancy Mortality Surveillance System
US 59% Increase
Maternal Mortality Ratio (per 100K births), 2000-2019,
U.S. & Comparable Countries*
www.birthbythenumbers.org
Slide78Summary
No matter how you structure a comparison, the U.S. fares poorly in cross-national comparisons.
If you include all countries, the U.S. ranks in the 50s; if you limit it to large wealthy countries, the U.S. ranks 10
th…out of 10 countries.In terms of comparative trends, the U.S. in 2000 had a maternal mortality rate double the average for the comparison countries and over the next 16 years fell further behind.www.birthbythenumbers.org
Slide796. The Persistence of Racial Disparities
www.birthbythenumbers.org
Slide80U.S. Maternal Mortality (per 100,000 live births), 1951-2007 by Race
Source:
NCHS. Maternal Mortality and Related Concepts. Vital & Health Statistics. Series 33; #3. & annual data reports. 1915-1960 data from NCHS.
Vital Statistics Rates In The United States 1940-1960. NOTE: Shifts in measurement (e.g. not all states were part of registration system prior to 1933; infant race was based on race of the child until 1980 & then race of the mother post 1980) accounts for some of the variation over time. 2007-2016 based on 2 year estimates of the pregnancy related mortality rate: Petersen E. MMWR.9/6/19.
www.birthbythenumbers.org
Slide81Black to White Ratios, U.S. Maternal Mortality, 1915-2019
Source:
NCHS. Maternal Mortality and Related Concepts. Vital & Health Statistics. Series 33; #3. & annual data reports. 1915-1960 data from NCHS.
Vital Statistics Rates In The United States 1940-1960. NOTE: Shifts in measurement (e.g. not all states were part of registration system prior to 1933; infant race was based on race of the child until 1980 & then race of the mother post 1980) accounts for some of the variation over time. 2007-2016 based on 2 year estimates of the pregnancy related mortality rate: Petersen E. MMWR.9/6/19.Ratio
Maternal Mortality
www.birthbythenumbers.g
Slide82Black to White Ratios, U.S. Infant & Maternal Mortality, 1915-2019
Source:
NCHS. Maternal Mortality and Related Concepts. Vital & Health Statistics. Series 33; #3. & annual data reports. 1915-1960 data from NCHS.
Vital Statistics Rates In The United States 1940-1960. NOTE: Shifts in measurement (e.g. not all states were part of registration system prior to 1933; infant race was based on race of the child until 1980 & then race of the mother post 1980) accounts for some of the variation over time. 2007-2016 based on 2 year estimates of the pregnancy related mortality rate: Petersen E. MMWR.9/6/19.Ratio
Infant Mortality
Maternal Mortality
www.birthbythenumbers.org
Slide83Pregnancy Related Mortality Ratios
by Race, U.S., 2015-2016
Source: Petersen E. et al. Racial/Ethnic Disparities in Pregnancy-Related Deaths — U.S., 2007–2016
. MMWR. 9/6/19; 68(35):762-765.
www.birthbythenumbers.org
Slide84Pregnancy Related Mortality Ratios (per 100,000 births) by Race/Ethnicity, U.S. 2007-2016.
Source: Petersen E. et al. Racial/Ethnic Disparities in Pregnancy-Related Deaths — U.S., 2007–2016
.
MMWR. 9/6/19; 68(35):762-765. www.birthbythenumbers.org
Slide85Pregnancy-related mortality ratios
(per 100,000 live births)
by race/ethnicity, U.S. 2007-2016
Source: Petersen E et al. Racial/Ethnic Disparities in Pregnancy-Related Deaths — United States, 2007–2016.
MMWR
2/7/19; 68 (35): 762-765.
www.birthbythenumbers.org
Slide86Pregnancy-related mortality ratios
(per 100,000 live births)
by race/ethnicity, U.S. 2007-2016
Source: Petersen E et al. Racial/Ethnic Disparities in Pregnancy-Related Deaths — United States, 2007–2016. MMWR 2/7/19; 68 (35): 762-765.
www.birthbythenumbers.org
Slide87Maternal mortality rates, by race & Hispanic origin and age: United States, 2019
Source: Hoyert DL. Maternal mortality rates in the United States, 2019. NCHS Health E-Stats. 2021.
DOI: https://doi.org/10.15620/cdc:103855.
Maternal deaths per 100,000 births
Slide88Maternal mortality rates, by race & Hispanic origin and age: United States, 2019
Source: Hoyert DL. Maternal mortality rates in the United States, 2019. NCHS Health E-Stats. 2021.
DOI: https://doi.org/10.15620/cdc:103855.
Maternal deaths per 100,000 births
Slide89Manifestation of Racial Disparities
Leading Underlying Causes of
Pregnancy- Related
Deaths, by Race-EthnicitySource: CDC. 2018. Report from 9 Maternal Mortality Review Committees.
www.birthbythenumbers.org
Slide90Cause-specific pregnancy-related mortality, by race/ethnicity, U.S., 2007-2016 (%)
Source: Petersen E et al. Racial/Ethnic Disparities in Pregnancy-Related Deaths — United States, 2007–2016.
MMWR
2/7/19; 68 (35): 762-765.
AIAN
– American Indian, Alaskan Native;
Asian PI
– Asian Pacific Islander
17%
15%
14%
14%
16%
14%
20%
14%
15%
15%
20%
15%
16%
17%
12%
www.birthbythenumbers.org
Slide91Maternal Mortality by Race,
U.S. (2018) and U.K. (2015-2017)
Sources: U.S.,
Hoyert DL, Miniño AM. Maternal mortality in the U.S., 2018. Nat’l Vital Stat Rep.; vol 69 no 2. NCHS. 2020; MBRRACE-UK. UK and Ireland Confidential Enquiries into Maternal Deaths and Morbidity 2015-17. Oxford:NPEU, 2019
www.birthbythenumbers.org
Slide92Summary
Racial disparities in maternal mortality have existing in the U.S. as long as data has been collected.
The consistency of the disparity with Black maternal mortality ratios 3 to 4 times that of white maternal mortality for decades reflects the lack of progress made in the U.S.
Presently, the disparity does not reflect SES differences, with maternal education providing no protection for Black mothers.The maternal mortality ratios for American Indian/Alaskan natives were also far higher than those for white and Hispanic mothers. www.birthbythenumbers.org
Slide937. Maternal Mortality as a Public Health Problem:
Timing & Causes of Death
www.birthbythenumbers.org
Slide94Remember this chart?
Timing of
Pregnancy Related
DeathsSource: Petersen E. et al. Vital Signs: Pregnancy-Related Deaths, United States, 2011–2015, and Strategies for Prevention, 13 States, 2013–2017. MMWR .vol.68. May 7, 2019. 1-7.
Maternal deaths are a public health issue as much as a clinical care issue.
www.birthbythenumbers.org
Slide95Maternal Mortality as a Public Health Approach
Cause-specific proportionate
Pregnancy-Related
mortality: United States, 1987–2013.Source: Creanga. Pregnancy-Related Mortality in the United States. Obstet Gynecol 2017.
+67%
+417%
+96%
+83%
-60%
-23%
-60%
-58%
-92%
-21%
www.birthbythenumbers.org
Slide96Pregnancy-related deaths, by cause of death and time of death relative to the end of pregnancy, 2011-15
Source:
PetersenE
. Vital Signs: Pregnancy-Related Deaths, U.S., 2011–2015. MMWR 2019; 68:423-29. 24%24%
26%
12%
19%
14%
24%
18%
20%
19%
21%
16%
17%
41%
13%
15%
15%
12%
14%
www.birthbythenumbers.org
Slide97Moving to a Public Health Approach
Underlying Causes of Pregnancy-Related Deaths, by
Timing of Death
%
Source: CDC. 2018.
Report from 9 Maternal Mortality Review Committees.
www.birthbythenumbers.org
Slide98Summary
If only a third of maternal deaths occur at the time of birth, solutions have to look beyond the birth hospitalization to improve outcomes.
We have made considerable strides in improving care at the time of birth. The recent increases have been largely among cardiovascular conditions, many of which only manifest after the birth.
There are clearly different patterns of causes of death by timing indicating a need for more nuanced approaches. Research into the underlying causes of death suggests a need for a greater focus on maternal mental health, particularly in the postpartum period. www.birthbythenumbers.org
Slide998. The Issue is Broader than Maternal Mortality
www.birthbythenumbers.org
Slide100Not just about maternal mortality
www.birthbythenumbers.org
Slide101Births in U.S. by Maternal Age, 2019
Age
# Births
%
<20
173,461
4.6%
20-24
704,342
18.8%
25-29
1,078,097
28.8%
30-34
1,089,281
29.1%
35+
702,359
18.7%
Total
3,747,540
100.0%
www.birthbythenumbers.org
Source: CDC Wonder
Slide102The Problem is Bigger than Maternal Mortality
Overall Deaths rates (per 100K), Females
25-34
, by Race/Ethnicity, 2000-2019
Non-Hispanic White
All
Hispanic
Non-Hispanic Asian Pacific Isl.
Source: CDC Wonder
www.birthbythenumbers.org
Non-Hispanic Black
Non-Hispanic AIAN
Slide103The Problem is Bigger than Maternal Mortality
Deaths rates (per 100K), Females
25-34
, by Race/Ethnicity, 2010-19
All
% Increase
2010-2019
Source: NCHS.CDC Wonder Online Database
Death Rates (per 100,000)
All Female
Deaths 25-34
--
13,067; 2019
–
17,827
NOTE: Pregnancy related mortality rate increased by <1% 2010-2017
www.birthbythenumbers.org
Non-Hispanic Black
50%
23%
31%
-7%
29%
12%
Slide104Ratio of Black/White Female Death Rates, Women 25-34, 2000-2019
NHW Rate Increase 2000-2019: 52.3%
NHB Rate
Decrease
2000-2019:
-11.9%
www.birthbythenumbers.org
Source: CDC Wonder
Slide105Problem is Bigger than Maternal Mortality
Top 10 Causes of Death for Women
25-34
in 2019
2019 Total Deaths
% of total
Rate per 100 K
% Change in rate 2010-2019
Proportion of 2010-19 Increase
All causes
17,827
100.0
78.9
18.1%
---
Accidents (unintentional inj.)
6,598
37.0
29.2
57.8%
59.4%
Malignant neoplasms
1,833
10.3
8.1
-10.0%
0.0%
Intentional self-harm (suicide)
1,526
8.6
6.8
28.3%
9.1%
Diseases of heart
1,167
6.5
5.2
6.1%
3.3%
Assault (homicide)
807
4.5
3.6
9.1%
2.6%
Pregnancy, childbirth & puerperium
532
3.0
2.4
33.3%
3.5%
Chronic liver disease and cirrhosis
418
2.3
1.9
111.1%
5.0%
Diabetes mellitus
325
1.8
1.4
7.7%
1.3%
Cerebrovascular diseases
276
1.5
1.2
0.0%
0.5%
Influenza and pneumonia,
210
1.22
0.9
12.5%
0.9%
All other causes (residual)
4,135
23.2
18.3
17.3%
14.4%
Sources: CDC, NCHS
. Underlying Cause of Death 1999-2018 on CDC WONDER Detailed Mortality Database, released in 2021. Accessed at http://wonder.cdc.gov/ucd-icd10.html on Jan. 14, 2021
www.birthbythenumbers.org
Slide106Increases in Female Deaths 2010-2019: 47% of the overall increase came from 1 cause
Increase: 2,582
13,067
17,827
www.birthbythenumbers.org
Sources: CDC, NCHS
. CDC WONDER Online Detailed Mortality Database, released in 2020. Accessed at http://wonder.cdc.gov/ucd-icd10.html on Mar 9, 2020 10:27:59 PM
Slide107Increase in Drug Induced Deaths, by Race/Ethnicity, 2010 & 2019
311%
Increase
171%
Increase
76%
Increase
www.birthbythenumbers.org
CDC, NCHS
. CDC WONDER Online Detailed Mortality Database, released in 2020. Accessed at http://wonder.cdc.gov/ucd-icd10.html on Mar 9, 2020 10:27:59 PM
168%
Increase
Slide108Summary
Pick your idiom: tip of the iceberg or canary in the coal mine – the 700 maternal deaths are a warning about a much larger problem in the U.S. -- the rising death rate among women of reproductive age.
While the pregnancy related mortality rate has remained steady since 2010, the overall death rate for women 25-34 has increased by 23%.
The death rate for non-Hispanic women is rising at a much faster rate than the rate among non-Hispanic black women.The primary cause of these increases in deaths appears to be substance use. www.birthbythenumbers.org
Slide1099. The Way Forward
www.birthbythenumbers.org
Slide110PreventabilityDefinition:
A death is considered preventable if the committee determines there was at least some chance of the death being averted by one or more reasonable changes to patient, family, provider, facility, system and/or community factors.
Source: Berg CJ, Harper MA, Atkinson SM, Bell EA, Brown HL,
HageML, et al. Preventability of pregnancy-related deaths: results of a state-wide review. ObstetGynecol2005;106:1228–34.
Slide111States Funded Through ERASE MM
Source:
https://www.cdc.gov/reproductivehealth/maternal-mortality/erase-mm/index.html
www.birthbythenumbers.org
Slide112Maternal Mortality Review Committees (MMRCs) in 50 State and Local Jurisdictions
Slide113US Maternal Mortality Surveillance
CDC – National Vital Statistics System (NVSS)
CDC – Pregnancy Mortality Surveillance System (PMSS)
State and Local Maternal
Mortality Review Committees
(MMRCs)
Data Source
Death
certificates
Death
certificates linked to fetal death and birth certificates
Death
certificates linked to fetal death and birth certificates, medical records, social service records, autopsy, informant interviews, etc.
Time Frame
During pregnancy – 42 days
During pregnancy – 365 days
During pregnancy – 365 days
Source
of Classification
ICD-10 codes
Medical epidemiologists
Multidisciplinary
committees
Terms
Maternal death
Pregnancy associated,
(Associated and) Pregnancy related,
(Associated but) Not pregnancy
related
Pregnancy associated,
(Associated and) Pregnancy related,
(Associated but) Not pregnancy
related
Measure
Maternal Mortality Rate - # of Maternal Deaths per 100,000 live births
Pregnancy Related Mortality Ratio - # of Pregnancy Related Deaths per 100,000 live births
Pregnancy Related Mortality Ratio - # of Pregnancy Related Deaths per 100,000 live births
Purpose
Show national trends and provide
a basis for international comparison
Analyze clinical factors associated with deaths, publish information that may lead to prevention strategies
Understand medical and non-medical contributors to deaths, prioritize interventions that effectively reduce maternal deaths
Reviewed in:
Callaghan, William M. 2012. Overview of maternal mortality in the United States. Seminars in perinatology. 36; 1: 2-6.
St. Pierre A, Zaharatos J, Goodman D, Callaghan WM. Challenges and opportunities in identifying, reviewing, and preventing maternal deaths.
Obstet
Gynecol
. 2018;131(1):138–142.
Slide114Slide115Slide116Slide117Slide118Source:
Daw
J.
Health Affairs 2017; 36:598-6069. The Way ForwardKeeping Women in the System
www.birthbythenumbers.org
Slide119Medicaid Eligibility for Parent vs Pregnant Women in Non-Expansion States
Medicaid eligibility thresholds, 2021
Source:
Ranji et al. Expanding Postpartum Medicaid Coverage. Kaiser Family Foundation, March 9, 2021
www.birthbythenumbers.org
Slide12020
10
30
25
15
Anonymized State Specific Pregnancy Related Mortality Ratios
(per 100,000 live births)
2006-2013
% Black Births in State
Source: Adapted from: Kramer M.et.al.
Am J OBGYN
.2019.609
www.birthbythenumbers.org
Slide121Source:
NCHS.
NVSS
. Maternal Mortality by State, 2018-2019. Personal communication, Donna Hoyertwww.birthbythenumbers.org
Maternal Mortality Ratio, U.S. States, 2018-19
Slide122Is expanding Medicaid eligibility out to 1 year postpartum the answer?
Sort of…
Since a significant proportion (12%)of maternal deaths occur between 42-365 postpartum, keeping women, especially vulnerable women, in the health care system makes sense.
There is also the matter of how women on Medicaid are treated when they are getting care. www.birthbythenumbers.org
Slide123Survey Results (Adjusted Odds Ratios*) among women on Medicaid compared to private insurance
* Adjusted for maternal age, prenatal provider, race/ethnicity, maternal education, US born, pregnancy complications, and agreement with statement “childbirth shouldn’t be interfered with unless medically necessary.” All ratios significant at p < .05.
Source: Declercq, E. Women’s experience of agency & respect in maternity care by type of insurance in Cal.. PLOS One. 2020;
15(7): e0235262
www.birthbythenumbers.org
Slide124Four Policy Recommendations
1. Use Maternal Mortality Review Committees to
explore pregnancy associated deaths
for causes and possible bases for prevention;2. Use linked datasets to examine women’s health through the lifecourse and identify critical moments (e.g. pregnancy?) where intervention might matter; 3. Fund a systematic process for listening to women tell us about their lives and experiences in pregnancy and beyond to craft sustainable solutions that are meaningful to them.
4. Craft policies that keep
women of all ages
within the health and social system to prevent problems that lead to pregnancy associated deaths.
www.birthbythenumbers.org
Slide125www.birthbythenumbers.org
Slide126FACEBOOK
: www.facebook.com/BirthByTheNumbers
Twitter:
@BirthNumbers
Email:
birthbynumbers@gmail.com
Jordy
Staige
Lucy
Corey
Ruby
Allison
Sarah
Christina
Kylia
Veronica
Brittany
Jessica
Kali
Katie
Sheridan
Ebere
Lee
Maya
Annette
Sam
Isabelle
Maura
www.birthbythenumbers.org