
Cholera a waterborne bacterial disease infects millions of people each year leading to thousands of deaths Predicting favorable conditions for cholera infection relies on identifying areas of above average temperatures and rainfall poor water infrastructures and changes in land use To tackle t ID: 915375
Download Presentation The PPT/PDF document "Predicting Cholera in Yemen using NASA S..." is the property of its rightful owner. Permission is granted to download and print the materials on this web site for personal, non-commercial use only, and to display it on your personal computer provided you do not modify the materials and that you retain all copyright notices contained in the materials. By downloading content from our website, you accept the terms of this agreement.


Slide1
Predicting Cholera in Yemen using NASA Satellites
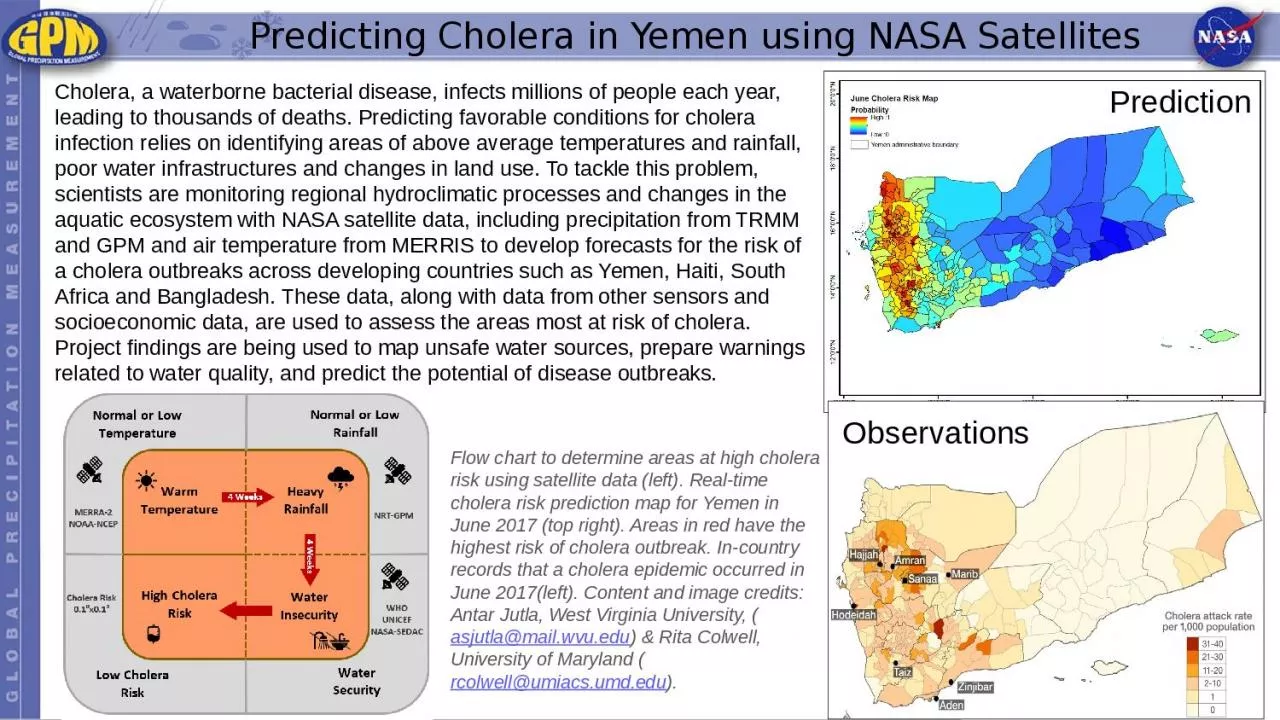
Cholera, a waterborne bacterial disease, infects millions of people each year, leading to thousands of deaths. Predicting favorable conditions for cholera infection relies on identifying areas of above average temperatures and rainfall, poor water infrastructures and changes in land use. To tackle this problem, scientists are monitoring regional hydroclimatic processes and changes in the aquatic ecosystem with NASA satellite data, including precipitation from TRMM and GPM and air temperature from MERRIS to develop forecasts for the risk of a cholera outbreaks across developing countries such as Yemen, Haiti, South Africa and Bangladesh. These data, along with data from other sensors and socioeconomic data, are used to assess the areas most at risk of cholera. Project findings are being used to map unsafe water sources, prepare warnings related to water quality, and predict the potential of disease outbreaks.
Flow chart to determine areas at high cholera risk using satellite data
(left).
Real-time
cholera risk prediction map for Yemen in June 2017 (top
right). Areas in red have the highest risk of cholera outbreak. In-country records that a cholera epidemic occurred in June 2017(left). Content and image credits: Antar Jutla, West Virginia University, (asjutla@mail.wvu.edu) & Rita Colwell, University of Maryland (rcolwell@umiacs.umd.edu).
Prediction
Observations