
DISCUSSION Voltage differences between adjacent foils Table 2 are nonlinear possibly due to stray capacitances with housing which can in turn provoke unequal electric field stresses between element terminals Highest stresses occur at bushings and connections to internal elements where the dr ID: 1031562
Download Presentation The PPT/PDF document "SIMULATION AND RESULTS Electrical circui..." is the property of its rightful owner. Permission is granted to download and print the materials on this web site for personal, non-commercial use only, and to display it on your personal computer provided you do not modify the materials and that you retain all copyright notices contained in the materials. By downloading content from our website, you accept the terms of this agreement.


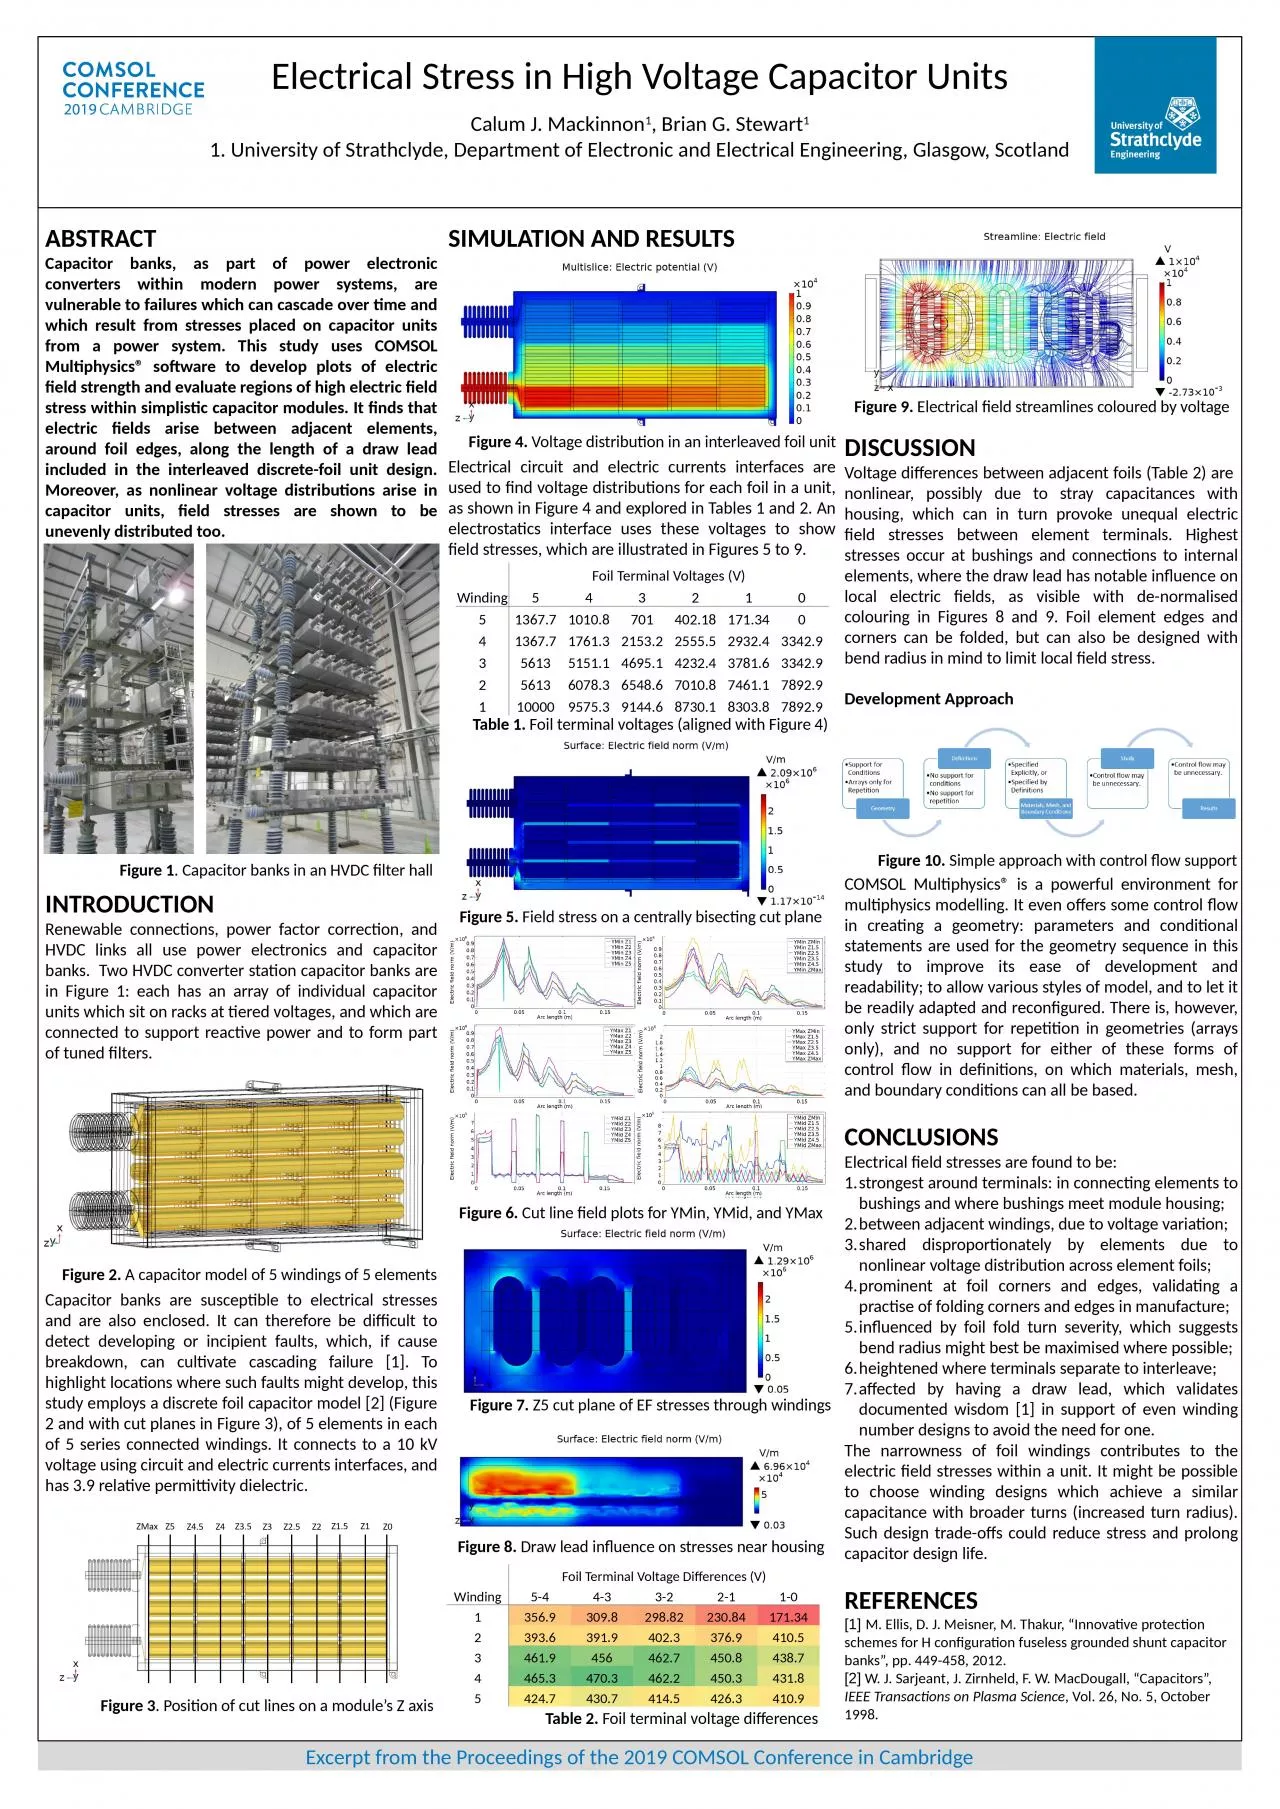
1. SIMULATION AND RESULTSElectrical circuit and electric currents interfaces are used to find voltage distributions for each foil in a unit, as shown in Figure 4 and explored in Tables 1 and 2. An electrostatics interface uses these voltages to show field stresses, which are illustrated in Figures 5 to 9.DISCUSSIONVoltage differences between adjacent foils (Table 2) are nonlinear, possibly due to stray capacitances with housing, which can in turn provoke unequal electric field stresses between element terminals. Highest stresses occur at bushings and connections to internal elements, where the draw lead has notable influence on local electric fields, as visible with de-normalised colouring in Figures 8 and 9. Foil element edges and corners can be folded, but can also be designed with bend radius in mind to limit local field stress.Development ApproachCOMSOL Multiphysics® is a powerful environment for multiphysics modelling. It even offers some control flow in creating a geometry: parameters and conditional statements are used for the geometry sequence in this study to improve its ease of development and readability; to allow various styles of model, and to let it be readily adapted and reconfigured. There is, however, only strict support for repetition in geometries (arrays only), and no support for either of these forms of control flow in definitions, on which materials, mesh, and boundary conditions can all be based. CONCLUSIONSElectrical field stresses are found to be:strongest around terminals: in connecting elements to bushings and where bushings meet module housing;between adjacent windings, due to voltage variation;shared disproportionately by elements due to nonlinear voltage distribution across element foils;prominent at foil corners and edges, validating a practise of folding corners and edges in manufacture;influenced by foil fold turn severity, which suggests bend radius might best be maximised where possible;heightened where terminals separate to interleave;affected by having a draw lead, which validates documented wisdom [1] in support of even winding number designs to avoid the need for one.The narrowness of foil windings contributes to the electric field stresses within a unit. It might be possible to choose winding designs which achieve a similar capacitance with broader turns (increased turn radius). Such design trade-offs could reduce stress and prolong capacitor design life.REFERENCES[1] M. Ellis, D. J. Meisner, M. Thakur, “Innovative protection schemes for H configuration fuseless grounded shunt capacitor banks”, pp. 449-458, 2012.[2] W. J. Sarjeant, J. Zirnheld, F. W. MacDougall, “Capacitors”, IEEE Transactions on Plasma Science, Vol. 26, No. 5, October 1998.Electrical Stress in High Voltage Capacitor UnitsCalum J. Mackinnon1, Brian G. Stewart11. University of Strathclyde, Department of Electronic and Electrical Engineering, Glasgow, Scotland Figure 3. Position of cut lines on a module’s Z axisFigure 1. Capacitor banks in an HVDC filter hallExcerpt from the Proceedings of the 2019 COMSOL Conference in CambridgeABSTRACTCapacitor banks, as part of power electronic converters within modern power systems, are vulnerable to failures which can cascade over time and which result from stresses placed on capacitor units from a power system. This study uses COMSOL Multiphysics® software to develop plots of electric field strength and evaluate regions of high electric field stress within simplistic capacitor modules. It finds that electric fields arise between adjacent elements, around foil edges, along the length of a draw lead included in the interleaved discrete-foil unit design. Moreover, as nonlinear voltage distributions arise in capacitor units, field stresses are shown to be unevenly distributed too. INTRODUCTIONRenewable connections, power factor correction, and HVDC links all use power electronics and capacitor banks. Two HVDC converter station capacitor banks are in Figure 1: each has an array of individual capacitor units which sit on racks at tiered voltages, and which are connected to support reactive power and to form part of tuned filters. Capacitor banks are susceptible to electrical stresses and are also enclosed. It can therefore be difficult to detect developing or incipient faults, which, if cause breakdown, can cultivate cascading failure [1]. To highlight locations where such faults might develop, this study employs a discrete foil capacitor model [2] (Figure 2 and with cut planes in Figure 3), of 5 elements in each of 5 series connected windings. It connects to a 10 kV voltage using circuit and electric currents interfaces, and has 3.9 relative permittivity dielectric.Figure 2. A capacitor model of 5 windings of 5 elementsFigure 4. Voltage distribution in an interleaved foil unitTable 1. Foil terminal voltages (aligned with Figure 4) Foil Terminal Voltages (V)Winding54321051367.71010.8701402.18171.34041367.71761.32153.22555.52932.43342.9356135151.14695.14232.43781.63342.9256136078.36548.67010.87461.17892.91100009575.39144.68730.18303.87892.9Figure 5. Field stress on a centrally bisecting cut planeFigure 6. Cut line field plots for YMin, YMid, and YMaxFigure 7. Z5 cut plane of EF stresses through windingsFigure 8. Draw lead influence on stresses near housing Foil Terminal Voltage Differences (V)Winding5-44-33-22-11-01356.9309.8298.82230.84171.342393.6391.9402.3376.9410.53461.9456462.7450.8438.74465.3470.3462.2450.3431.85424.7430.7414.5426.3410.9Table 2. Foil terminal voltage differencesFigure 9. Electrical field streamlines coloured by voltageFigure 10. Simple approach with control flow support