/
Station Capacity   Presentation Overview Station Capacity   Presentation Overview

Station Capacity Presentation Overview - PowerPoint Presentation

pagi
pagi . @pagi
Follow
66 views
Uploaded On 2023-09-24

Station Capacity Presentation Overview - PPT Presentation

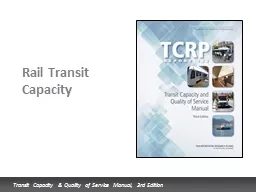
Learning objectives Station types amp configurations Passenger circulation and level of service Station elements and their capacities Example problems Learning Objectives Understand the different types of transit stations ID: 1020498

design station pedestrian capacity station design capacity pedestrian flow passenger width transit speed ft2 amp evacuation planning fruin step

Share:

Link:

Embed:

Download Presentation from below link

Download Presentation The PPT/PDF document "Station Capacity Presentation Overview" is the property of its rightful owner. Permission is granted to download and print the materials on this web site for personal, non-commercial use only, and to display it on your personal computer provided you do not modify the materials and that you retain all copyright notices contained in the materials. By downloading content from our website, you accept the terms of this agreement.


Presentation Transcript

1. Station Capacity

2. Presentation OverviewLearning objectivesStation types & configurationsPassenger circulation and level of serviceStation elements and their capacitiesExample problems

3. Learning ObjectivesUnderstand the different types of transit stationsBe familiar with passenger circulation and level of service conceptsLearn about the range of station elements and methods of measuring their capacitiesConsider some typical station analysis problems

4. Changes in 3rd EditionSignificantly expanded discussion of passenger flow microsimulation Introduction of alternate stair capacity method based on stair lanes (instead of width)Introduction of clearance time analysis methodExpanded discussion of volume-to-capacity ratio analysis for station elementsVarious updates to text

5. Station TypesandConfigurationsTower City–Public Square Station, Cleveland

6. Types of Stops, Stations, and TerminalsBus stopsOn-streetFew or no amenitiesTransit centersUsually off-streetFew to many amenitiesTransit stationsOff-streetMany amenitiesBusway stationsLight rail stationsHeavy rail stationsCommuter rail stationsFerry docks and terminalsIntermodal terminals

7. Types of Stops, Stations, and Terminals IllustratedOn-street bus stop, AlbuquerqueOff-street transit center, San DiegoRapid transit station, San FranciscoGrand Central Terminal, New York

8. Passenger Circulation and Level of ServiceRapid transit station, Toronto

9. Principles of Pedestrian FlowPedestrian speed is related to pedestrian densityThe more pedestrians, the slower the average pedestrian speedFlow (how many pedestrians can pass by a given point) is the product of pedestrian speed and density:V = S ×DUnits: pedestrians per foot width per minuteAverage space per pedestrianis related to speed and flow:M = S / VUnits: square feet per pedestrianMinato Mirai Station, Yokohama

10. Applying Pedestrian Flow PrinciplesMost design problems relate to solving for either:Station element width (e.g., stairway width)Station element area (e.g., platform area)Result is a station element sized to accommodate a given number of persons per hour, at a design level of servicePeel Station, Montreal

11. Design QuestionsHow many bus bays (loading areas) are needed?Is there enough room for passengers to wait and circulate?Is there enough space & passenger demand for particular amenities?Springfield Station, Springfield, Oregon

12. More Design QuestionsAre passenger processing elements (e.g., stairs, escalators, and faregates) adequately sized and provided in sufficient number?Which station element(s) constrain capacity?What are the requirements for emergency evacuation?South Kensington Station, London

13. Design IssuesAmericans with Disabilities Act (ADA)ADA requirements affect designAddressed in TCQSM to the extent it impactsthe sizing of station elementsTCQSM provides input into the design process,but isn’t a design manualSpringfield Station, Springfield, Oregon

14. Emergency Evacuation

15. Emergency Evacuation DesignStation design must address evacuation requirementsMaximum time to evacuate platforms and reach a point of safetyBased on worst-case passenger accumulations Overall passenger flow through station is an important consideration (watch for bottlenecks!) National Fire Protection Association standard 130 (NFPA 130) specifies evacuation design needs“Standard for Fixed Guideway Transit and Passenger Rail Systems”

16. NFPA 130 General ConsiderationsSufficient exit capacity to evacuate station occupants (including those on trains) from platforms in 4.0 minutes or lessSufficient exit capacity to get from most remote point on platform to point of safety in 6.0 minutes or lessSecond egress route remote from major egress route from each platformMaximum distance to an exit from any point on a platform not more than 325 ftLimits on assuming availability of escalators for evacuation capacityAbove based on the 2010 version of the standardAlways check the most recent versionTypically updated every 3 years

17. Number of People to Design for EvacuationLoads of one peak period train on each trackAssume each train is one headway late (i.e., is carrying twice its normal load, but no more than its maximum capacity load)Passengers on platform during the peak 15 minutes, assuming trains are one headway late

18. Design for Both Evacuation and Normal Operations Maximum capacity required for normal operations or emergency evacuation will govern the sizing of a station elementBecause emergency evacuation routes may be different than the routes taken by passengers during normal operations, don’t assume that evacuation needs will govern in all cases

19. Station Elements and Their CapacitiesCanary Wharf Station, London (weekend)

20. Find the Station ElementsShelterTicket MachinePedestrian AccessBus AccessWalkwayCustomer InfoBenchPhoneTrash CanLightingLandscapingGuidewayPlatformStairsElevatorSunset Transit Center, near Portland

21. Not Pictured…FaregatesPark-and-rideBike storageArtworkElectronic displaysStation agentsDoorways/gatesRestroomsDriver break areasVending machinesEscalatorsRampsKiss-and-rideMoving walkways

22. Waiting AreasStreetcar stop, Portland

23. Passenger Waiting AreasProcess for sizing passenger waiting areas is based on designing for a desirable level of serviceConcepts originally presented in Fruin’s Pedestrian Planning & DesignHCM has similar concepts, but intended for sidewalks—TCQSM’s levels of service are intended for transit facilitiesLevel of service measure: average space per person

24. Waiting Area LOSLOS ALOS BLOS CLOS DLOS ELOS F≥ 13 ft2 per person10-13 ft2 per person7-10 ft2 per person3-7 ft2 per person2-3 ft2 per person< 2 ft2 per person

25. WalkwaysFerry terminal, New Orleans

26. Pedestrian Flow on WalkwaysSource: J. Fruin, Pedestrian Planning and Design

27. Walkway LOSLOS ALOS BLOS CLOS DLOS ELOS F≥ 35 ft2/p, avg. speed 260 ft/min25-35 ft2/p, avg. speed 250 ft/min15-25 ft2/p, avg. speed 240 ft/min10-15 ft2/p, avg. speed 225 ft/min5-10 ft2/p, avg. speed 150 ft/min< 5 ft2/p, avg. speed <150 ft./min

28. Walkway LOSSource: J. Fruin, Pedestrian Planning and Design

29. WalkwaysTypical average free flow pedestrian speed for design: 250 ft/minCapacity occurs at LOS E/F thresholdPedestrians move at a shuffle

30. Walkway Design ProcessBased on desired LOS, identify maximum flow rate per unit widthEstimate demand for peak 15 minutes (or shorter period surges)Allow for wheelchairs and people with large itemsCompute design pedestrian flow: (Step 2) / 15Effective width = (Step 4 / Step 1)Add appropriate buffer width on each side(depends on elements to each side)

31. Stairs andEscalatorsHollywood & Vine Station, Los Angeles

32. Pedestrian Flow on StairsSource: J. Fruin, Pedestrian Planning and Design

33. Pedestrian Ascent Speed on StairsSource: J. Fruin, Pedestrian Planning and Design

34. Stairway LOSSource: J. Fruin, Pedestrian Planning and Design

35. Stairway Capacity FactorsEven minor reverse-direction flows may reduce stairway capacity by as much as one-halfAlthough sizing procedures may suggest a continuum of stairway widths, capacity is really added in one-person-width increments (roughly 30 inches)Alternate method to analyze stair capacity based on stair “lanes” (new in 3rd Edition)

36. Stairway Design FactorsMuch new construction will use escalators as the primary vertical circulation elementCan design to LOS E in this caseWhere stairs will be the primary vertical circulation element, design to LOS C to DEmergency evacuation needs may result in better LOS during normal conditions

37. Stairway Design ProcessBased on desired LOS, identify maximum flow rate per unit widthEstimate peak 15-minute demandCompute design pedestrian flow: (Step 2) / 15Required width = (Step 3 / Step 1)If minor, reverse-direction flow use occurs, add width of one lane (30 inches)

38. Escalator Capacity FactorsEscalator widthTypically “single”, “intermediate”, or “double” widthOperating speedWheaton Station, Washington, DC area

39. Escalator Capacity FactorsManufacturers often state capacity based on a theoretical capacity—two people on every step—which is never obtainedCapacity reduction factorsIntermittent pedestrian arrivalsPedestrian hesitation at boarding (especially elderly and persons with disabilities)Pedestrians carrying baggage or packagesPedestrian desire for a more comfortable spacing

40. Escalator CapacityNominal capacity values based on one person every other step (single-width), or one person every step (double-width)Intermediate-width escalators have capacity close to double-width but less comfort and flexibility for walkingSource: J. Fruin, Pedestrian Planning and Design; unpublished New York City Transit data

41. ElevatorsWashington Park Station, Portland

42. Elevator UsageUsually for persons with disabilities and auxiliary to stairs/escalators, but can be primary vertical circulation in deep stationsDeep station access:New York: 168th, 181st, and 191st StreetsWashington, DC: Forest GlenPortland, OR: Washington ParkWhen not working, impacts station access for mobility impaired, particularly when only a single elevator is providedElevator outage information, Washington, DC

43. Elevator CapacityCalculated similarly to transit vehicle capacity:Car capacity is combination of loading standard (area per passenger) and elevator floor areaTime to make round-trip, including time to load and unload passengers, and open and close doorsStation access elevators sometimes have doors on two sides for simultaneous loading and unloadingWalk-in, walk-out without turning around

44. MovingWalkwaysCourt Square–23rd Street Station, New York

45. Moving WalkwaysTypical speed 100 ft/min, some up to 160 ft/minUsually slower than typical walking speedCapacity limited at entranceSpeed not a factor for capacity unless it causes persons to hesitate when enteringCapacity similar to escalatorsDouble-width: about 90 people/min

46. DoorwaysManhattan Whitehall ferry terminal, New York

47. Doorway CapacitySource: J. Fruin, Pedestrian Planning and Design

48. FareControlFaregates, Chicago

49. Fare Control CapacityEach combination of equipment, fare media, and fare structure has a distinct processing timeSources: J. Fruin, Pedestrian Planning and Design Transit Capacity & Quality of Service Manual, 2nd Edition L.S. Weinstein, TfL’s Contactless Ticketing: Oyster and Beyond A. Weinstein et al., Human Factor Constraints on Transit Faregate Capacity

50. TicketMachinesTicket machines, New York

51. Ticket Machine CapacityTicket machines are one of the least-standardized portions of riding transit from one city to another (and sometimes even within cities)Service time per passenger varies widely depending on machine design and complexity of fare systemConsiderable variation in design and operationInfrequent passengers require more timeConsider impacts of out-of-service machinesConsider sun glare issues with outdoor machines

52. MicrosimulationEmbarcadero Station, San Francisco

53. Passenger Flow MicrosimulationUse of microsimulation software for analysis of station capacity and exiting requirements is expanded significantly.Microsimulation, which represents the cumulative movement of thousands of individuals, is better able to analyze and present the complex interactions of pedestrians in a busy multi-directional environment.Visual representations better communicate flow patterns and potential issues to decision-makers and the public

54. Passenger Flow MicrosimulationOutputs include video clips, maps, and tabular dataChoose simulation parameters and outputs to address relevant issues(not to show off the outputs) Map of Mean Pedestrian Density on a Subway Platform

55. Passenger Flow MicrosimulationOptional: link a short microsimulation video to this slide.Set short clip to auto-loop.PB will provide video clip.

56. More InformationTCRP Report 165: TCQSM—Chapter 10, Station CapacityJohn J. Fruin, Pedestrian Planning and Design, Revised Edition, Elevator World, Inc., 1987The TCQSM is available as:Free individual printed copies and PDF downloads through the TCRP Dissemination Programhttp://www.tcrponline.org Free PDF downloads directly from TCRPhttp://www.trb.org/TCRP/Public/TCRP.aspx (Publications section)or simply do an Internet search for the report number (e.g., TCRP Report 165)Individual or multiple copy purchases from the TRB Bookstorehttp://books.trbbookstore.org/

57. Acknowledgments and PermissionsPresentation authorsMark Walker (Parsons Brinkerhoff, Quade & Douglass), based on an earlier presentation by Paul Ryus (Kittelson & Associates, Inc.)Photo creditsElevator outage & Wheaton station: WMATA photo by Larry LevineAll others: Paul RyusThis presentation was developed through TCRP Project A-15CResearch team: Kittelson & Associates; Parsons Brinkerhoff, Quade & Douglass; KFH Group; Texas A&M Transportation Institute; and ArupThis presentation and its contents may be freely distributed and used, with appropriate credit to the presentation authors and photographers, and the Transit Cooperative Research Program