
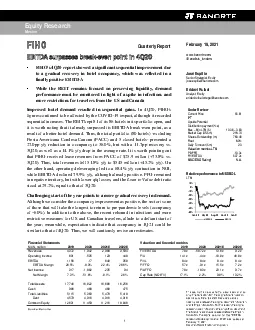
Valuation and financial metricsMXN million201920202021E2022E201920202021E2022ERevenues4372194229003594FVEBITDA70x5072x136x92xOperating Income691535129440PU141x44x188x468xEBITDA115617648958PVL0 ID: 873755
Download Pdf The PPT/PDF document "Financial Statements" is the property of its rightful owner. Permission is granted to download and print the materials on this web site for personal, non-commercial use only, and to display it on your personal computer provided you do not modify the materials and that you retain all copyright notices contained in the materials. By downloading content from our website, you accept the terms of this agreement.


1 Financial Statements Valuation and finan
Financial Statements Valuation and financial metrics MXN, million 2019 2020 2021E 2022E 2019 2020 2021E 2022E Revenues 4,372 1,942 2,900 3,594 FV/EBITDA 7.0x -507.2x 13.6x 9
2 .2x Operating Income 691 -535 129 440 P/
.2x Operating Income 691 -535 129 440 P/U 14.1x -4.4x -18.8x 46.8x EBITDA 1,156 -17 648 958 P/VL 0.4x 0.4x 0.4x 0.4x EBITDA Margin 26.5% -0.9% 22.4% 26.6% P/FFO 5.7x -9
3 .1x 15.5x 7.2x Net Income 317 -1,002 -23
.1x 15.5x 7.2x Net Income 317 -1,002 -235 94 P/AFFO 7.0x -10.3x 23.1x 9.7x Net Margin 7.3% -51.6% -8.1% 2.6% Cap Rate (NOI/FV) 17.1% 2.2% 9.8% 13.2% Total Assets 17,746
4 16,822 16,686 16,256 Cash 906 460 468 4
16,822 16,686 16,256 Cash 906 460 468 475 Total Liabilities 5,115 5,363 5,470 5,410 Debt 4,579 4,916 4,916 4,916 Common Equity 12,631 11,459 11,216 10,846 Source: Bano