

UNIT 1 Basic Economic Concepts Scarcity Society has unlimited wants Economic resources are scarce Economic Resources include land all gifts of nature Labor all physical and mental talents ID: 569458
Download Presentation The PPT/PDF document "AP Exam Review" is the property of its rightful owner. Permission is granted to download and print the materials on this web site for personal, non-commercial use only, and to display it on your personal computer provided you do not modify the materials and that you retain all copyright notices contained in the materials. By downloading content from our website, you accept the terms of this agreement.


Slide1
AP Exam Review
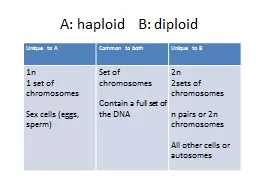
UNIT 1 Basic Economic ConceptsSlide2
Scarcity
Society has unlimited wantsEconomic resources are scarceSlide3
Economic Resources include:
land – all gifts of natureLabor – all physical and mental talents
Capital – manufactured aids used in producing goods and services
Entrepreneurial ability – takes initiative and riskSlide4
Opportunity Cost
what must be given up in order to get something Slide5
Production Possibilities Model
Graphic representation of opportunity cost
Each point on the curve represents some
maximum output of two productsSlide6
Law of increasing opportunity cost –
the
more of a product that is produced, the greater its
opportunity
cost
Shape of the curve illustrates the lawGuns and butter is a classic economics comparison. Guns represent capital goods and butter represents consumer goods.Slide7
Increase in resources
Advances in technology
Production
possibilities curve may shift if:Slide8
Production Possibilities Curve PracticeSlide9
Assume the economy represented is presently producing 12 units of Good B and 0 units of good A.
The opportunity cost of increase production of Good A from 0
units to 1 unit is the loss of _____________ unit(s) of Good B.
The opportunity cost of increasing production of Good A from 1
unit to 2 units is the loss of ________ units(s) of Good B.The opportunity cost of increasing production of Good A from 2 units to 3 units is the loss of ______ unit(s) of Good B.This is an example of ________________ opportunity cost per unit for Good A.Slide10
Assume the economy represented is presently producing 12 units of Good B and 0 units of good A.
The opportunity cost of increase production of Good A from 0
units to 1 unit is the loss of
2
unit(s) of Good B.
The opportunity cost of increasing production of Good A from 1 unit to 2 units is the loss of 2 units(s) of Good B.The opportunity cost of increasing production of Good A from 2 units to 3 units is the loss of 2 unit(s) of Good B.This is an example of constant opportunity cost per unit for Good A.Slide11
More Production Possibilities PracticeSlide12
Assume the economy represented
Is currently producing 12 units of Good B and 0 units of Good A.
The opportunity cost of increasing production of Good A from 0 units to 1 unit is the loss of _____unit(s) of Good B.
The opportunity cost of increasing production of Good A from 1 unit to 2 units is the loss of _____ unit(s) of Good B.
The opportunity cost of increasing production of Good A from 2 units to 3 units is the loss of ____ unit(s) of Good B.
This is an example of _____ opportunity cost per unit for Good A.Slide13
Assume the economy represented
Is currently producing 12 units of Good B and 0 units of Good A.
The opportunity cost of increasing production of Good A from 0 units to 1 unit is the loss of
2
unit(s) of Good B.
The opportunity cost of increasing production of Good A from 1 unit to 2 units is the loss of 4 unit(s) of Good B.The opportunity cost of increasing production of Good A from 2 units to 3 units is the loss of 6 unit(s) of Good B.This is an example of increasing opportunity cost per unit for Good A.Slide14
More Production Possibilities PracticeSlide15
Assume that the following data represents 4 years of GDP for the US
.
Assume that “Efficient” levels of production would create 5% unemployment.
Show the four years on a
single
PPC graph.
Show each year as a point on the graph and show new frontiers if appropriate.Label the PPC graph correctly. GDP for the yearUnemployment %Year A10 Trillion Dollars10%Year B11 Trillion Dollars 5%Year C15 Trillion Dollars10%Year D
16.5 Trillion Dollars 5%
Production Possibilities Curve PracticeSlide16
Capital Goods
Consumer Goods
HINT – start like this
GDP for the year
Unemployment %
Year A10 Trillion Dollars10%Year B11 Trillion Dollars 5%
Year C15 Trillion Dollars
10%
Year D
16.5 Trillion Dollars
5%Slide17
Capital Goods
Consumer Goods
11 trillion
A
GDP for the year
Unemployment %Year A10 Trillion Dollars10%Year B11 Trillion Dollars
5%Year C
15 Trillion Dollars
10%
Year D
16.5 Trillion Dollars
5%Slide18
Capital Goods
Consumer Goods
11 trillion
A
B
GDP for the yearUnemployment %Year A10 Trillion Dollars10%
Year B11 Trillion Dollars
5%
Year C
15 Trillion Dollars
10%
Year D
16.5 Trillion Dollars
5%Slide19
Capital Goods
Consumer Goods
11 trillion
A
B
16.5 trillion
C
GDP for the yearUnemployment %
Year A
10 Trillion Dollars
10%
Year B
11 Trillion Dollars
5%
Year C
15 Trillion Dollars
10%
Year D
16.5 Trillion Dollars
5%Slide20
Capital Goods
Consumer Goods
11 trillion
A
B
16.5 trillion
CD
GDP for the year
Unemployment %
Year A
10 Trillion Dollars
10%
Year B
11 Trillion Dollars
5%
Year C
15 Trillion Dollars
10%
Year D
16.5 Trillion Dollars
5%Slide21
Supply and DemandChange in quantity supplied
Caused by a price change
Movement along the curve
Change in supply
caused by determinants of supply
Shift of the curve
Change in quantity demandedCaused by price changeMovement along the curveChange in demand Caused by determinants of demandShift of the curveSlide22
Price CeilingSlide23
Price FloorSlide24
Basic Economic Concepts Test QuestionsSlide25
If an effective price floor is removed from a market for good, then the price and quantity of the good
sold will change in which of the following ways? Price
Quantity
a. Increase Increase b. Increase Decrease
c. Decrease Decrease d. No change Increase e. Decrease Increase Slide26
Which of the following would best explain an inward shift of the production possibilities curve?
a. A decrease in the quantity of inputs required to produce a unit of output. b. An increase in the rate of savings. c. A decrease in the quality of human capital
d. A decrease in the government’s budget deficit that leads to lower real
interest
rates.
e. An increase in the labor force participation rate.Slide27
The best combination of belts and coats for this economy is
a. 95 belts and 1 coat
b. 85 belts and 2 coats
c. 70 belts and 3 coats
d. 40 belts and 4 coats
e. indeterminate with the available information
Slide28
Which of the following could explain the movement from point B to point A?
a. An increase in consumer income.
b. An increase in the price of a complementary good.
c. An increase in the price of a substitute good.
d. An increase in the price of the good
e. None of the above.