
Lee Garlock KD4RE Assisted by Ron Payne WA6YOU A Vienna Wireless Society Presentation THE APPLICATIONS in AMATEUR RADIO by MODULE 1 THE BASICS All time varying signals audio ultrasonic RF etc can be represented and plotted as a function of time or frequency ID: 493880
Download Presentation The PPT/PDF document "SPECTRUM ANALYZER" is the property of its rightful owner. Permission is granted to download and print the materials on this web site for personal, non-commercial use only, and to display it on your personal computer provided you do not modify the materials and that you retain all copyright notices contained in the materials. By downloading content from our website, you accept the terms of this agreement.


Slide1
SPECTRUM ANALYZER
Lee Garlock, KD4REAssisted by Ron Payne, WA6YOU
A Vienna Wireless Society Presentation
THE
APPLICATIONS
in AMATEUR RADIO
bySlide2
MODULE 1
THEBASICSSlide3
All time varying signals (audio, ultrasonic, RF, etc.) can be represented and plotted as a function of time or frequency.For a simple sinewave F(t) = sin(2πft
+σ) and F(ω) = 2πfThe principal for converting time domain data to frequency domain data is the Fourier transform developed by Jean-Baptiste Joseph Fourier (1768–1830) who was working on heat transfer.F(ω) = ∫ f(t) * ε-jω
t dtThe Fast Fourier Transform is a computer algorithm based on digital sampling of a signal that can compute the frequency components from time samples of a signalRequires sample sizes that are powers of two (e.g. 1024, 2048. 4096)
SIGNAL REPRESENTATIONSlide4
TIME DOMAIN DISPLAYSignals are displayed in the time domain on oscilloscopes.
Amplitude on the vertical axis versus time on the horizontal axis.Amplitude is typical linear (volts/division)The first oscillographs used a galvanometer to record on a rotating paper drum or film in late 1890s.The CRT oscilloscopes first appeared in the WWI era.By the 1930s General Radio introduced a general used oscilloscope.Up through 1980s oscilloscopes were analog with CRT displays but developed sophisticated trigger circuits and bandwidths from several MHz up to 1 GHz.
Today most scopes sold are digital with LCD displays and high end scopes have sampling rates in 10s of Gigasamples per second and GHz bandwidths.Slide5
EVOLUTION of the OSCILLOSCOPESlide6
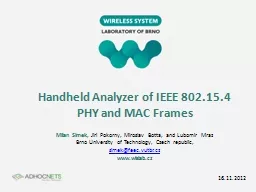
A BASIC ANALOG OSCILLOSCOPE
AmplifierTime Base
Saw Tooth Generator
Trigger Circuit
Horizontal Amp
Vertical AmpSlide7
FREQUENCY DOMAIN DISPLAY An Analog Spectrum
Analyzer is basically a SUPERHETERODYNE receiver with a swept local oscillator (LO) and sometime linear detector with a display similar to an oscilloscope.Displays frequency on the X-AXIS and amplitude in the Y-AXIS.Most modern systems have a
PEAK-HOLD function.Most have “ZERO SPAN”
mode: LO is fixed and display is SIGNAL vs. TIME.Slide8
FREQUENCY DOMAIN DISPLAY Real Time Spectrum Analyzers
are digital sampling systems that implement a Fast Fourier Transform to display power levels within frequency bins across the display. Can provide AMPLITUDE vs. FREQUENCY display like conventional analog analyzers.Can provide a WATERFALL DISPLAY (cascading FFTs over time).Most can show sample
AMPLITUDE vs. TIME.Slide9
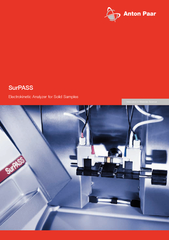
ANALOG SPECTRUM ANALYZERAttenuator
YIG Filter (opt)
IF Filters
(Resolution Bandwidth)
IF Amp
Log/Linear Detector
Vert Amp
Voltage Controlled Local Oscillator (Sweep Generator)
Time Base
Saw Tooth Generator
Horizontal Amp
Video Amplifier and
Lowpass
filtersSlide10
EVOLUTION of the ANALOG SPECTRUM ANALYZERSlide11
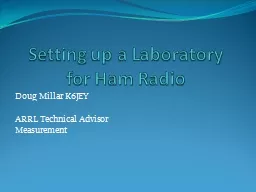
BASIC REAL-TIME SPECTRUM ANALYZER (SDR)
RF Filters
Local Oscillator (tunable in steps)
Low Pass
FilterTuner Unit
A/D Converter
Signal Conditioner
FFT Processor (software, FPGA, hardware)
Display System (Video and LCD)
Control and User Interface
Processor Unit
Sample Rate Clock
Key Factors:
Tuner Frequency Range
Sampling Rate (Bandwidth)
Number of Bits
Processor Speed for FFTsSlide12
REAL-TIME SPECTRUM ANALYZERSCOST RANGES
$0.00 Software for PC (audio)$250K (26 GHz, 14 bit, 150 MHz instant β)
$3K for 6 GHz, 14 bit ,
30 MHz instant
β
+ PC
$12 for 2 GHz, 8 bit
2 MHz instant
β
+ PCSlide13
MODULE 2
SPECTRUM ANALYZER CONTROLS and LIMITATIONSSlide14
SPECTRUM ANALYZER CONTROLSMajor ControlsREFERENCE LEVEL
(maximum displayed amplitude) & Input Attenuation.START and STOP Frequencies of Display (or Center Frequency and Span).RESOLUTION BANDWIDTH (width of IF filters) and Video
Bandwidth.SWEEP TIME.LOG/LINEAR DISPLAY on some units and dBm
/DIVISION.ZERO SPAN MODE
fixed LO frequency-display received SIGNAL vs. TIME.Slide15
LimitationsSpan, Resolution Bandwidth, and Sweep Time are interrelated in ANALOG ANALYZERS.
Since the analyzer is swept in frequency it needs a finite amount of time to obtain a reading of the amplitude within the resolution bandwidth selected; there is a maximum sweep rate for a given span and resolution bandwidthREAL-TIME ANALYZERS need to ensure A/D converter saturation does not occur. Resolution depends on number of samples in FFT, sampling rate. Since based on samples of data, artifacts occur like spectrum leakage which may be addressed by weighing input samples.
SPECTRUM ANALYZER CONTROLSSlide16
MODULE 3
SPECTRUM ANALYZER ACCESSORIESSlide17
ACCESSORIES#1 TRACKING
GENERATOROriginally a separate unit for older units like to HP 141.Usually an option on modern units covering up to 1.5 GHz or so.Generates an RF signal at the same frequency the Spectrum Analyzer is tuned at an output jack.#2 HIGH IMPEDANCE PROBENominal input impedance of Spectrum Analyzers is 50
Ω.To use the spectrum analyzer as a circuit probe get or build a HIGH-Z probe that provides a 50
Ω output and high impedance
input.
With A Tracking generator you can consider the Spectrum Analyzer as a Scalar Network AnalyzerSlide18
ACCESSORIES (continued)#3
RETURN LOSS BRIDGEWith Tracking Generator can measure return loss for any port of a network (such as Antenna VSWR)#4 LOW NOISE AMPLIFIER Provides increased sensitivity.Slide19
HIGH IMPEDANCE PROBE from EDN Magazine 2005 by Steve Hageman (author of several QEX/QST articles).Slide20
REVIEW Think of the Spectrum
Analyzer as a Precision Calibrated Receiver that can accurately measure INPUT LEVELS vs. FREQUENCY.Measure FM DEVIATION and MODULATION characteristics.Measure HARMONIC DISTORTION of
modulators and amplifiers.Measure HARMONIC LEVELS of transmitters, amplifiers,
oscillators.Measure
RESIDUAL NOISE of oscillators.With a probe tool for TROUBLESHOOTING
RF equipment and TUNING receivers and transmitters.Slide21
REVIEW (continued)
With a Tracking Generator you can do GAIN/LOSS measurements vs. FREQUENCY.Measure LOSS through networks, cables, etc. ; i.e. any two-port device. TUNE
RF filters (Diplexers, LC, Crystal filters). MEASURE CHARACTERISTICS
of Crystals for design of filters.
Measure GAIN of Amplifiers vs. FrequencyAdd a
RETURN-LOSS BRIDGE and you can do one port return-loss measurements; i.e. VSWR vs. FREQUENCY.Slide22
MODULE 4
SPECTRUM ANALYZER DEMONSTRATIONSlide23
Modulation Measurement.HT with a Tektronix 491 S/A.HP UHF SigGen
with Rigol 851 S/A.Insertion Loss Measurement.40 Feet RG-58A/U.10 Feet RG-174/U.40 Meter VWS Band Pass Filter. Slide24
QUESTIONS ?
COMMENTS ?kd4re@arrl.net
(ARE YOU READY TO BUY A SPECAN YET ?)
KD4RE
THANK YOU