
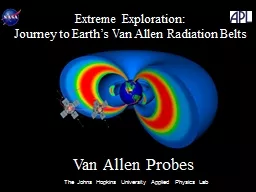
What I Would Like Machine Learning to Learn Geoffrey Reeves Reeves LANLgov GReeves NewMexicoConsortiumorg European Space Weather Week 2016 The Van Allen Radiation Belts Challenges and Opportunities ID: 553319
Download Presentation The PPT/PDF document "The Van Allen Radiation Belts:" is the property of its rightful owner. Permission is granted to download and print the materials on this web site for personal, non-commercial use only, and to display it on your personal computer provided you do not modify the materials and that you retain all copyright notices contained in the materials. By downloading content from our website, you accept the terms of this agreement.


Slide1
The Van Allen Radiation Belts: What I Would Like Machine Learning to Learn
Geoffrey Reeves
Reeves @ LANL.govGReeves @ NewMexicoConsortium.org
European Space Weather Week 2016Slide2
The Van Allen Radiation Belts: Challenges and Opportunities for Space Weather Forecasting
Geoffrey Reeves
Reeves @ LANL.govGReeves @ NewMexicoConsortium.org
European Space Weather Week 2016Slide3
The Radiation Belt Revolution
The 25 years from CRRES to Van Allen Probes exposed new forecasting challenges
Shock events (although rare) can accelerate electrons to 10s MeV in minutes
‘Normal’ acceleration events can accelerate electrons to many MeV in hours
Bigger storms do not necessarily create bigger radiation belt events
Storms can either increase or decrease radiation belt fluxes
Wave-particle interactions are responsible for acceleration, transport, and loss
The solar wind driving / coupling function is not well-understood
Radiation Belt responses are different at different energies and at different L-shellsSlide4
But We Predict Pretty Well Though Right?Slide5
Yes… But…
We predict one energy in one orbit pretty well
Predictions are good on longer time scales but we don’t predict changes very wellPredictions focus on single energies not spectral hardness
Global Data Assimilation models (DREAM, VERB, BAS…) are mature but operational prototyping is just beginning
We still can’t even guess whether a CME / CIR will produce net increases or decreases in fluxes in a given orbit of interest
When things are bad we can’t tell operators how long they will stay bad,
which energies will be bad, or which orbits will be bad
Etc…Slide6
The Belts at different Energies and L-shells
1.5 MeV
0.5 MeV
0.25 MeVSlide7
Reeves et al., 2016Slide8
Reeves et al., 2016Slide9
Energy (log scale)
Reeves et al., 2016Slide10Slide11
This is a Complicated Prediction Problem - Or Is It?
Enhanced State
Quiescent State
ΔT = 45 hoursSlide12
Time
L-Shell
Energy
Energy
apogee
perigee
perigee
apogee
perigeeSlide13
L-Shell
Active - Enhanced State
Energy
50 keV
4 MeV
1 MeV
100 keVSlide14
L-Shell
Active - Enhanced State
Energy
50 keV
4 MeV
1 MeV
100 keV
Location of Flux Peak
Location of BoundarySlide15
L-Shell
Quiescent State
The Enhancement Decays
Energy and L-dependent
“Bite-out” at intermediate energies
Energy
50 keV
4 MeV
1 MeV
100 keVSlide16
L-Shell
Active - Enhanced State
Energy
50 keV
4 MeV
1 MeV
100 keV
All of these are newly enhanced Electron FluxesSlide17
L-Shell
Active - Enhanced State
Energy
50 keV
4 MeV
1 MeV
100 keV
No Change in Electron FluxSlide18
March 17, 2013
L-Shell
Energy
L-Shell
Pre-Enhancement
Enhancement EventSlide19
May 1, 2013
L-Shell
Energy
L-Shell
Pre-Enhancement
Enhancement EventSlide20
May 25, 2013
L-Shell
Energy
L-Shell
Pre-Enhancement
Enhancement EventSlide21
June 1, 2013
L-Shell
Energy
L-Shell
Pre-Enhancement
Enhancement EventSlide22
June 7, 2013
L-Shell
Energy
L-Shell
Pre-Enhancement
Enhancement EventSlide23
April 23, 2013
L-Shell
Energy
L-Shell
Pre-Enhancement
Enhancement EventSlide24
Pre-Event
Boundary
Post-Event
Boundary
Post-Event
Flux Peak
Slot-Filling
EnergiesSlide25
Maximum
Flux Change
All Clear Region
Enhanced
FluxesSlide26
How Long Will Things Stay Bad?
What L-shells?What Energies?Slide27
L-Shell
Active - Enhanced State
Energy
50 keV
4 MeV
1 MeV
100 keVSlide28
L-Shell
Quiescent State
The Enhancement Decays
Energy and L-dependent
“Bite-out” at intermediate energies
Energy
50 keV
4 MeV
1 MeV
100 keV
Reeves et al., 2016Slide29
Ma et al., 2016Slide30
Ma et al., 2016Slide31
Ma et al., 2016Slide32
Conclusions
The radiation belts are highly structured in Energy and L-shell
There is considerable event-to-event variation, but… There are characteristics features in energy and L that are consistent and repeatablee.g. Enhancements at a given L-shell are always more common at lower energies == Enhancements at lower energies always penetrate more deeply than at higher energies.We may be able to relate those general probability distributions to solar wind driving conditionsSlide33
Conclusions
This coherence should also make it easier to make general predictions based on limited observations
e.g. Can we predict the slope and intensity of the maximum in electron fluxes as a function of energy and L?Energy and L-shell dependent loss rates should be even easier to predict because the physical process is clearerOnce we know the condition of the enhanced belt we should be able to predict where, at what energies, and how long things will be bad