
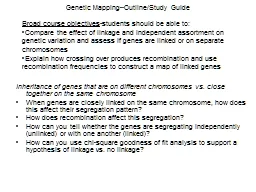
Mendels Law of Independent Assortment Autosomal linkage Genes that do not obey Mendels Law of Independent Assortment Linked genes Linkage is the tendency for a group of genes on the same chromosome to be inherited together ID: 774785
Download Presentation The PPT/PDF document " Autosomal linkage Genes that do not obe..." is the property of its rightful owner. Permission is granted to download and print the materials on this web site for personal, non-commercial use only, and to display it on your personal computer provided you do not modify the materials and that you retain all copyright notices contained in the materials. By downloading content from our website, you accept the terms of this agreement.


Slide1
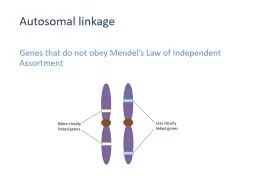
Autosomal linkage
Genes that do not obey Mendel’s Law of Independent Assortment
Slide2Autosomal linkage
Genes that do not obey Mendel’s Law of Independent Assortment
Slide3Linked genes
Linkage is the tendency for a group of genes, on the same chromosome, to be inherited togetherFor linkage to occur, the genes must be close to each other
Slide4Are the genes linked?
If genes are NOT linked, they are expected to follow Mendel’s Law of Independent Assortment
Sweet Peas Characters TraitsAllelesFlower color PurpleFRedfPollen grain shape LongLRoundl
Slide5Are the genes linked?
A two-point test cross allows scientists to determine if genes are linked or notIn order to perform a two-point test cross, one parent must be heterozygous, while the other parent is homozygous (for both traits)
PPhenotypesPurple LongXRed Round(Pure Bred)GenotypesFfLlffll
Test cross
-all recessive
Slide6Are the genes linked?
If the genes are NOT linked, phenotypic offspring ratios should follow Mendelian rules
RrLl
X
rrll
RL
RlrLrl
rl
RL
rl
Rl
rL
rl
RrLl
Rrll
rrLl
rrll
¼ purple & long
¼ purple & round
¼ red & long
¼ red & round
Slide7Are the genes linked?
If there are 1000 offspring and the genes are NOT linked, you would expect:
RL
rl
R
l
rL
rl
RrLl
Rrll
rrLl
rrll
¼ purple & long
¼ purple & round
¼ red & long
¼ red & round
250
250
250
250
a Mendelian ratio
Slide8Are the genes linked?
But, what if you have these results …
RL
rl
R
l
rL
rl
RrLl
Rrll
rrLl
rrll
¼ purple & long
¼ purple & round
¼ red & long
¼ red & round
380
128
118
374
NOT a Mendelian ratio
Slide9Linked genes
The parental combinations of alleles (purple/long and red/round) seem to be inherited as almost a 3:1 ratio to other offspring (recombinants)It’s as though they were behaving as a single characterThese genes are LINKED
Slide10Crossing over & recombinants
BUT, if these genes were perfectly linked together they would stay in their parental combinations (purple/long & red/round)
There would be no purple/round or red/long
These combinations are the result of
CROSSING OVER
between
the linked alleles on their chromosomes during Meiosis I
These are called
RECOMBINANTS
Slide11Meiosis & crossing over
Slide12Diagrams for linked genes
Genotypes for linked genes can be shown as:This is an example of a parental combination (FfLl)This genotype would give the same phenotype as:But this is an example of a recombinant
Slide13Recombinants
Note: recombinants are any combination of alleles that are not the same as the parental combinationsThis is not exclusive to the crossing over of linked genes
We will see this word
again when we studybiotechnology!
Slide14Genetic diagram for linked genes
PPhenotypesPurple LongXRed Round(Pure Bred)GenotypesGametesF Lf lF1PhenotypesAll Purple LongGenotypes
Slide15Genetic diagram for linked genes
F1PhenotypesAll Purple Long(Self-fertilized)Genotypescrossing over in meiosis IGametesF Lf lF lf LParental CombinationsRecombinants
Slide16How often does crossing over occur?
Run a test cross!!FfLl X ffll … and count your offspring
Slide17Calculating the cross over value
DrosophilaCharactersTraitsAllelesWing shapeNormalBBentbBody colourNormalEEbonye
Slide18Calculating the cross over value
PhenotypesHeterozygous wild typeXEbony BentGenotypesBbEebbeeGametesBE, Be, bE, bebe
If these genes are linked Be and bE could only be produced by crossing over
Slide19Calculating the cross over value
PhenotypesWild typeNormal EbonyBent NormalBent EbonyGenotypesBbEeBbeebbEebbeeNumbers83827671Approx. Ratio 25%25%25%25% Parental combinationRecombinants = 50% of the offspringParental combination
Slide20Calculating the cross over value
These results are typical of non-linked genesThe recombinants are in the same frequency as the parental combinationsNote: in this example, bent wing flies are a bit crippled so their offspring are not as viable. This accounts for their lower numbers.
Slide21Calculating the cross over value
DrosophilaCharactersTraitsAllelesEye colourRedPPinkpBody colourNormalEEbonye
Slide22Calculating the cross over value
Phenotypes
Heterozygous wild type
X
Pink
Ebony
Genotypes
P
p
E
e
pp
ee
Gametes
P
E
,
P
e,
p
E
,
p
e
p
e
Phenotypes
Wild type
Red Ebony
Pink Normal
Pink Ebony
Genotypes
P
p
E
e
P
p
ee
pp
E
e
pp
ee
Slide23Calculating the cross over value
The frequency of the recombinants is less than 50%This is an example of linkage
Phenotypes
Wild type
Red Ebony
Pink Normal
Pink Ebony
Genotypes
P
p
E
e
P
p
ee
pp
E
e
pp
ee
Numbers
601
3
4
584
Parental combinations
Recombinants < 50%
Parental combinations
Slide24Calculating the cross over value
The % recombination in a test cross is called the CROSS OVER VALUE (cov)The cross over value between ebony and pink =This value is important as it tells us how far apart the loci of the gene are on the chromosomeCross over values from several pairs of genes permit a geneticist to plot a gene map
Slide25Are these genes linked?
B = normal wingb = bent wingV = normal eyev = vermillion eye
BVbvBvbVbvBbVvbbvvBbvvbbVvExpected Results300300300300Actual Results310315287288
No
Slide26Are these genes linked?
B = normal wingb = bent wingV = normal eyev = vermillion eyeCalculate the cross over value.
BVbvBvbVbvBbVvbbvvBbvvbbVvExpected Results300300300300Actual Results480460130130
Yes
Slide27Mapping genes
Crossing over frequencies can be converted into map units1% = 1 mu (map unit)i.e. 5% crossing over rate = 5 map unitsGenes A and B cross over 6% of the timeGenes B and C cross over 12.5% of the time
Slide28Mapping genes
Draw a linkage map based on the following percentages:A – B = 8%B – C = 10%A – C = 2%
A
C
B
8.0
2.0
8.0 + 2.0 = 10.0
Notice: the distance of (A-B) + (A-C) = (B-C)
8 2 10
Slide29Mapping genes
Draw a linkage map based on the following units:A – D = 2 muB – D = 10 muC – B = 3 muA – C = 5 mu
Slide30Any questions?
Slide31Time to Practice
Slide32Slide33Let’s Do #1 on the Gene Mapping Worksheet
In 1911, Thomas Hunt Morgan collected the following crossover gene frequencies while studying Drosophila. Bar-shaped eyes are indicated by the B allele, and carnation eyes are indicated by the allele C. Fused veins on wings (A) and scalloped wings (S) are located on the same chromosomes.
Gene Combinations
Recombination Frequency
A/B
2.5%
A/C
3.0%
B/C
5.5%
B/S
5.5%
A/S
8.0%
C/S
11.0%
Slide34Try #2
Slide35Thought Lab 17.1: Mapping Chromosomes