

Total carbon sequestered to date over 80 kg Oakville Trafalgar HS and Appleby College sequestered 20075kg and 1962kg respectively This is significantly more than other schools 08kg Environmental stewardship of site and initiativeeffort are important to increasing carbon storage ID: 399149
Download Presentation The PPT/PDF document "Carbon Sequestration" is the property of its rightful owner. Permission is granted to download and print the materials on this web site for personal, non-commercial use only, and to display it on your personal computer provided you do not modify the materials and that you retain all copyright notices contained in the materials. By downloading content from our website, you accept the terms of this agreement.


Slide1
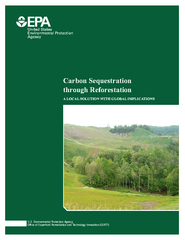
Carbon Sequestration
Total carbon sequestered to date: over 80 kg Oakville Trafalgar H.S. and Appleby College sequestered 20.075kg and 19.62kg, respectivelyThis is significantly more than other schools (0-8kg)Environmental stewardship of site and initiative/effort are important to increasing carbon storage Slide2Slide3
Health
Tree loss due to mortality or tree removal from site was 4%
Majority of trees are healthy/alive
Low browsing, sick/infested, dead/ dying, basal sprouting percentages were recordedSlide4
Average change in crown area (m2
) for P4C tree species planted 2008Slide5
Tree Canopy and Crown Area
View of Toronto’s tree canopy
(Credit: City of Toronto)Slide6
Tree canopy cover for mature tree species in P4C program
Species
Spread (m)
Area (m
2
)
Area (m
2
)/P4C Site
Basswood
13
169
507
Bur Oak
26
676
2028
Hop Tree
3-
5
9-
25
27-75
Sugar Maple
13
169
507
White Spruce
7
49
147
Total
3216-3264 (3.2-3.3km
2
)Slide7
Conclusions
More long-term monitoring plots should be established so that trends may be studied and to see if results are replicated
Environmental stewardship may significantly increase growth of trees which significantly increases carbon storageWe can study climate change impacts on trees and provide valuable environmental education at the same time Young citizen scientists’ data is important and P4C helps to spread environmental awarenessSlide8
Measuring Our ResourcesSlide9
Students measure and monitor the trees already located on their schoolyard grounds
Trees are tagged
and numberedMeasurements taken include height, DBH, and crown width. Tree health is also assessed and tree species are identified
Students create a sketch map of the trees that were measured
Data is inputted into databaseSlide10
Trees are numbered and tagged...Slide11
…and then growth measurements are taken
Height Measurement using clinometersSlide12
Tree ID and Health Status
STATUS CODE
A: Alive
B: Dead
S: Standing
L: Leaning
P:
Prone
HEALTH CODE
Mechanical Damage
NN: None
BD: Bark Damage
TB: Significant Top Breakage
RD: Visible Root Damage
CG: Complete
Girding
Defects
NN: None
DV: Minor Damage/Vandalism
AB: Animal Browsing
II: Insect Infestation
SD: Symptom of DiseaseSlide13
GPS/GISSlide14Slide15
Thank you!
ACER
905-891-6004Kathryn.chin@acer-acre.ca