
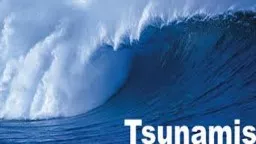
Waves part 2 Tsunami Tsunami terminology Japanese term meaning harbour wave Also called seismic sea waves Created by movement of the ocean floor by Underwater fault movement Underwater avalanches ID: 622479
Download Presentation The PPT/PDF document "Tsunami" is the property of its rightful owner. Permission is granted to download and print the materials on this web site for personal, non-commercial use only, and to display it on your personal computer provided you do not modify the materials and that you retain all copyright notices contained in the materials. By downloading content from our website, you accept the terms of this agreement.


Slide1
Tsunami
Waves part 2Slide2
Tsunami
Tsunami terminology
Japanese term meaning “
harbour
wave”
Also called “seismic sea waves”
Created by movement of the ocean floor by:
Underwater fault movement
Underwater avalanches
Underwater volcanic eruptionsSlide3
Where do Tsunamis Originate?
Most tsunami originate from underwater fault movementSlide4Slide5
Underwater fault movementSlide6Slide7
Tsunami characteristics
Can travel at speeds over
700 kilometers
Small wave height in the open ocean, so pass beneath ships unnoticed
Build up to extreme heights in shallow coastal areasSlide8Slide9
Coastal effects of tsunami
If trough arrives first, appear as a strong withdrawal of water (similar to an extreme and suddenly-occurring low tide)
If crest arrives first, appear as a strong surge of water that can raise sea level many meters and flood inland areasSlide10Slide11
Tsunamis: Dates & Fatalities Slide12
December 26, 2004
Sumatra Indonesia
Maximum wave: 35 meters (115
ft
!)
Fatalities: 300 000Slide13Slide14Slide15Slide16Slide17Slide18Slide19Slide20Slide21Slide22Slide23Slide24Slide25Slide26Slide27
Tsunami since 1900
Most tsunami are created near the margins of the Pacific Ocean along the Pacific “Ring of Fire”Slide28
Tsunami: Indonesia 2004
http://www.youtube.com/watch?v=RDOuwMj7XzoSlide29
Tsunami warning system
Seismic listening stations track underwater earthquakes that could produce tsunami
Once a large earthquake occurs, the tsunami must be verified at a nearby station
If verified, a tsunami warning is issued
Successful in preventing loss of life (if people heed warnings)
Damage to property has been increasingSlide30Slide31Slide32Slide33
Tsunami Activity
Velocity:
Tsunami velocity is controlled by
the water
depth, so velocity changes as a wave
nears the shore.
V = √(g)(D)D
is water depth and
g is the acceleration due to gravity (9.81 m/s )Amplitude: If the amplitude in deep water is known, the amplitude in shallower water can be calculated.As = Vd Ad VdAs = Ad ( Vd /Vs )d is the value in deeper waters is the value in shallower waterSlide34
Part A: Creating Your Table
Site
Water Depth (m)
Acceleration due to gravity (m/s
)
Velocity (m/s)
Amplitude ( m)
A
10009.81V = √(9.81)(1000)V = √9810V = 99.04B2509.81C1009.81
D509.81E109.81Step 1: Copy the table and Graph onto loose leaf.Step 2: Calculate Velocity for all 5 sites, using the formula.Step 3: Calculate Amplitude using velocityStep 4: Graph your data. You will have TWO graphs Slide35
Part B: Calculating Travel Time
Step 1:
Copy Chart onto loose leaf.
Step 2:
Trace the map of Newfoundland onto tracing paper.
Step 3:
Measure the distance between the epicenter and the 6 points. Note: All measurements need to be from the epicenter!
Step 4:
Calculate the Travel Time using the Time formula.Step 5: The time the Tsunami started was 5:00. Convert the travel time into minutes and add it to 5:00 to find the actual time.Step 6: Using a compass draw arcs at each point on your map, record the time on the map.Step 7: Answer questions 5 – 8.