
Chapter 16 Population Genetics and Speciation Terms to Know Population genetics study of evolution from a genetic point of view Microevolution evolution at the genetic level Bell Curve ID: 926616
Download Presentation The PPT/PDF document "16-1 Genetic Equilibrium" is the property of its rightful owner. Permission is granted to download and print the materials on this web site for personal, non-commercial use only, and to display it on your personal computer provided you do not modify the materials and that you retain all copyright notices contained in the materials. By downloading content from our website, you accept the terms of this agreement.


Slide1
16-1 Genetic Equilibrium
Chapter 16Population Genetics and Speciation
Slide2Terms to KnowPopulation genetics
– study of evolution from a genetic point of viewMicroevolution – evolution at the genetic levelBell Curve – most members of the population have similar traits; only a few are at the extremes
Can SHIFT over time!!!
Slide3Slide4Variations of Traits Within a PopulationCauses of Variation
MutationsTAGATC -> TAAATCRecombination (crossing-over and independent assortment)(during
meiosis)3. Random pairing of gametes
-which
sex cells combine successfully
Slide5The Gene Pool
Gene pool = the total genetic information available in a populationAllele Frequency = number of a certain allele / total number of alleles in a populationCalculated by … # of allele
B total # of
B
and
b
Slide6What is the allele frequency?Half a population of four o clocks are red/ half are white.
What is the frequency of the r allele? 0.50 or 50%
Slide7The Gene Pool
Phenotype Frequency = # of individuals with a phenotype / total # of individuals within the population #
red flowers/ Total # of individualsvideo
Slide8Hardy – Weinberg Genetic EquilibriumIdeal
hypothetical population that is not evolving (not changing over time)5 criteria (must be met)
No net mutations occurNo one enters or leaves the population
The population is large
Individuals mate randomly
Selection does not occur
Why might a population never be in HW genetic equilibrium???
Slide916-2 Disruption of Genetic Equilbrium
Slide10MutationGene flow –
the ability of genes (alleles) to be shared among members of a species (immigration and emigration)3. Genetic Drift – change in allele frequencies due to chance, usually because the population is small
Slide114. Nonrandom mating
– mate selection is influenced by geographic proximity, mates with similar traits, and sexual selection
Slide125.
Natural Selection – some members are more likely to survive and reproduce - stabilizing selection - disruptive selection
- directional selection
Slide13Types of SelectionStabilizing selection - individuals with average forms of a trait have the highest fitness
Ex. Large lizards will be spotted by predators; small lizards can’t run fast enough to get away from predators
Slide14Types of SelectionDisruptive Selection – individuals with either extreme of the trait has the greatest fitness
Ex. White moths on white trees cannot be seen; Dark moths on dark trees cannot be seen; medium colored moths will be seen on both trees (eaten by birds)
Slide15Types of SelectionDirectional selection – more extreme form of a trait has the greatest fitness
Ex. Anteaters with the longest tongues will get the most food
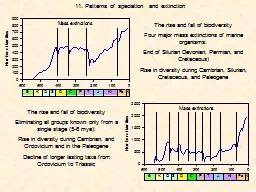
Slide16Slide17The Birth and Death of Genes
Slide1816-3 Formation of Species
Slide19The Concept of Species
Speciation – the process of species formationMorphology – internal and external appearance of an organismSpecies – morphologically similar and can interbreed to produce fully fertile offspring
Slide20Morphological vs Biological Species Concept2 competing concepts (ideas) on how to determine different species
Morph = based solely on appearanceBio = based on who can reproduce with who successfully (not useful for extinct or asexual organisms)
What do we use today?Mix of BOTH!!!
Slide21Isolation and SpeciationGeographic isolation – physical separation of members of a species
Ex. River dries up into several small pools; fish diverged enough to be considered separate species
Slide22Slide23Allopatric
speciation- when a new species arises as a result of geographic isolationGene flow stopsGene pools separateMost likely to occur in small pop.Becomes reproductively isolated
Slide24Reproductive Isolation
– species become genetically isolatedBarriers to successful breeding between groups in the same areaMay arise from disruptive isolation
Ex. Different mating times
Slide25Sympatric speciation- occurs when 2 groups become reproductively isolated in the same geographic areaReduce gene flow by exploring new niche
Slide26Slide27Rates of Speciation
Gradualism – speciation occurs at a regular, gradual ratePunctuated Equilibrium – sudden, rapid change then long periods of no changevideo
Slide28Slide29Slide30Ring Species
video
Slide31