
By pH meter used first and 2 nd derivatives Outcomes After completing this experiment the student should be able to 1 Calibration of pH meter 2 Calculation of first and 2 nd ID: 918970
Download Presentation The PPT/PDF document "Titration of the ascorbic acid (vitamin ..." is the property of its rightful owner. Permission is granted to download and print the materials on this web site for personal, non-commercial use only, and to display it on your personal computer provided you do not modify the materials and that you retain all copyright notices contained in the materials. By downloading content from our website, you accept the terms of this agreement.


Slide1
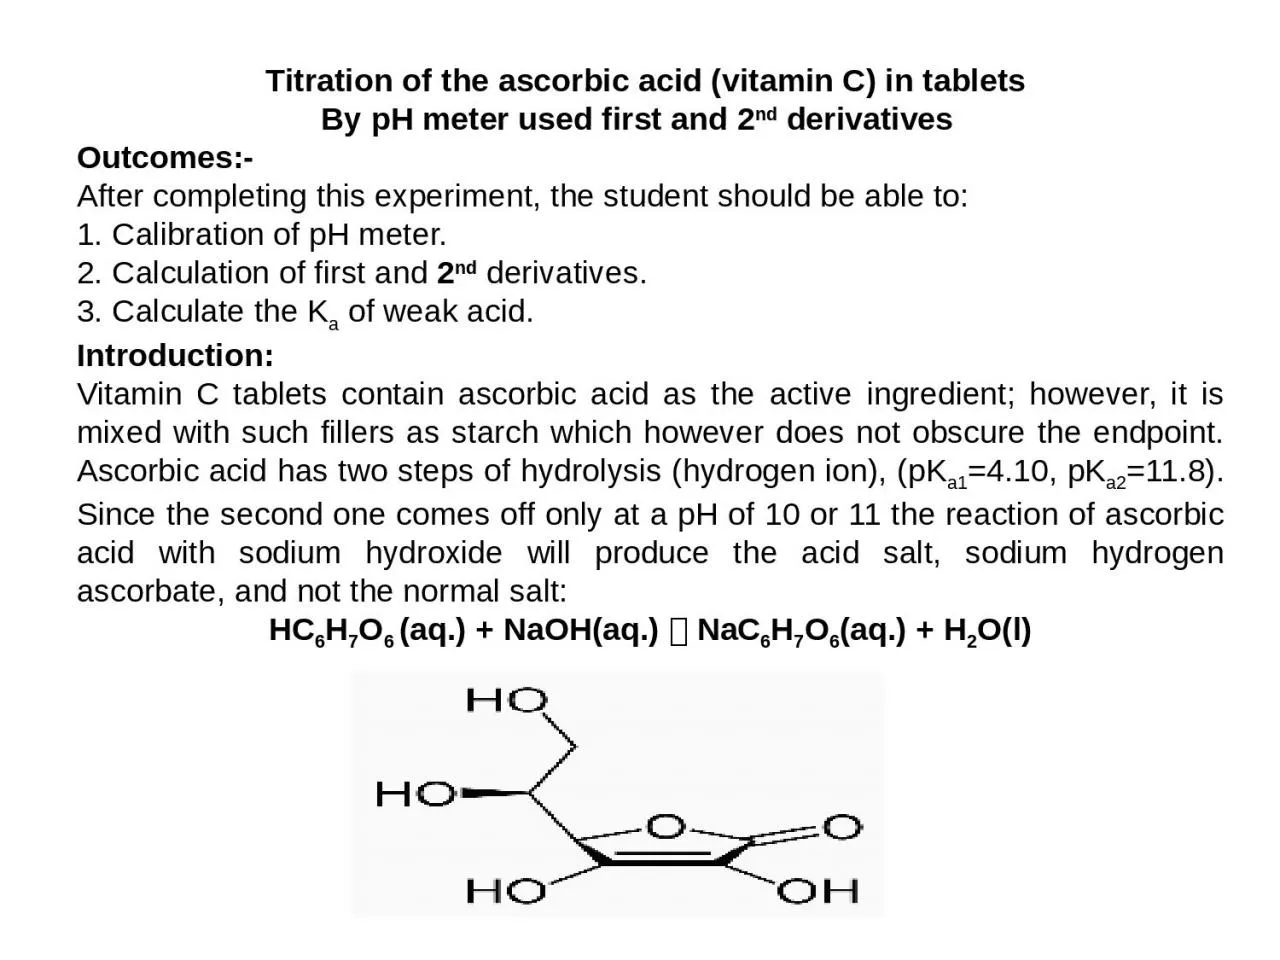
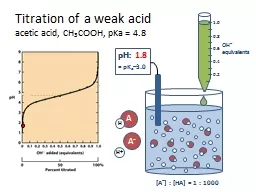
Titration of the ascorbic acid (vitamin C) in tablets By pH meter used first and 2nd derivatives Outcomes:-After completing this experiment, the student should be able to: 1. Calibration of pH meter.2. Calculation of first and 2nd derivatives.3. Calculate the Ka of weak acid. Introduction:Vitamin C tablets contain ascorbic acid as the active ingredient; however, it is mixed with such fillers as starch which however does not obscure the endpoint. Ascorbic acid has two steps of hydrolysis (hydrogen ion), (pKa1=4.10, pKa2=11.8). Since the second one comes off only at a pH of 10 or 11 the reaction of ascorbic acid with sodium hydroxide will produce the acid salt, sodium hydrogen ascorbate, and not the normal salt:HC6H7O6 (aq.) + NaOH(aq.) NaC6H7O6(aq.) + H2O(l)
Slide2Titration curve of 0.1 M ascorbic acid using 0.1 M NaOH as titrant
Slide3pH measurements with a Glass electrode The glass electrode used to measure pH is the most common ion-selective electrode. A typical pH combination electrode, incorporating both glass and reference electrodes in one body.Glass combination electrode with a silver-silver chloride reference electrode. The glass electrode is immersed in a solution of unknown pH so that the porous plug on the lower right is below the surface of the liquid. The two silver electrodes measure the voltage across the glass membrane.
Slide4The potential difference between inner and outer silver-silver chloride electrodes depends on the chloride concentration in each electrode compartment and on the potential difference across the glass membrane. Because [Cl−] is fixed in each compartment and because [H+] is fixed on the inside of the glass membrane, the only variable is the pH of analyte solution outside the glass membrane. The voltage of the ideal pH electrode changes by 59.16 mV for every pH-unit change of analyte activity at 25°C.
Slide5Errors in pH measurementStandards.Junction potentialJunction potential drift.Sodium error.Acid error.Equilibration time.Hydration of glass.Temperature.Cleaning.
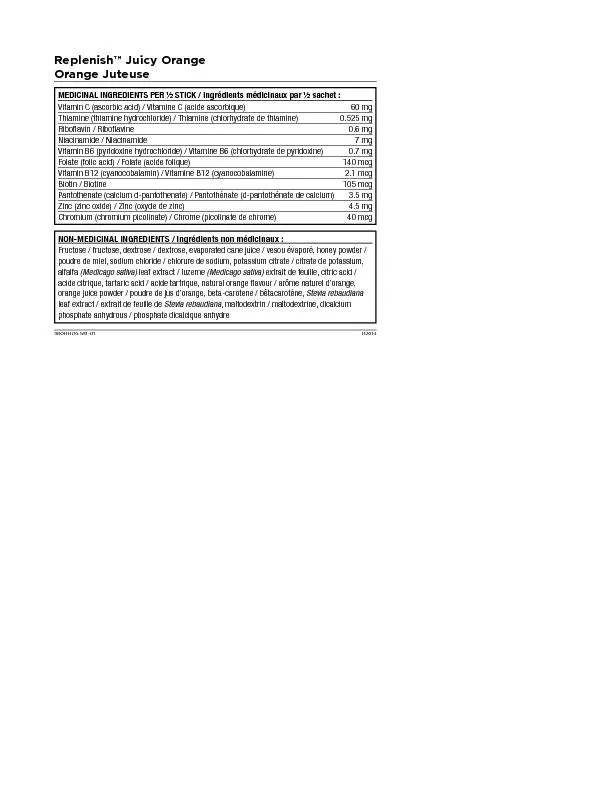
Slide6Procedure (pH-metric titration)Place a tablet of Vitamin C in a beaker, add about 50 mL of warm distilled water, and crush the tablet with a glass stirring rod. Cool down the solution.Dilute the sample in your volumetric flask to the total volume of 100-150 mL with distilled water.Place the beaker on magnetic stirrer insert the magnet in it, as well as pH-electrode. Ask the assistant to control the correctness of the installation and some advices.Measure and note pH; Repeat this adding small portions of the titrant base NaOH (few drops each), noting also the actual volume of titrant added (total). Finish titration when pH exceeds 12.
Slide7V of NaOHpHDV=V2-V1DpH=pH2-pH1DpH/DVAV=(V1+V2 )/2
Processing the results
Using a computer data-sheet, plot the titration curve obtained and determine as exactly as possible the volume of titrant corresponding to the inflection point.
For more aspiring students
:-
The preciseness of determination of the inflection point can be very improved if calculating the first and second derivatives of the titration curve.
Record all the numbers obtained, as well as the calculations made.
Note your observation concerning the comparison of your result with the factory value.
Slide8Multi-Component Analysis of a Vitamin B Mixture by UV-Vis. SpectroscopyOutcomes:-After completing this experiment, the student should be able to: Prepare standard solutions of mixture.Prepare 1% of HCl from 36% HCl.The conditions of accurate multi-component determination by UV-Vis. spectroscopy requires on Beer’s Law.The calculations of determination of Mixtures by UV. Vis. Absorption Spectroscopy.A UV-Vis. multi-component analysis mathematically separates each component of the sample; this requires the measurement of spectra for known standards of all the components which are present at any significant level in the sample. The mathematical method attempts to minimize the sum of the squares of the residual spectrum; this is done by constructing a matrix of the cross-products of each pair of standard scans, and then solving this with respect to the cross-product of the standard scans with the sample scan, the final step is to calculate the actual sample component concentrations from the known concentrations in each standard
Slide9Accurate multi-component determination by UV-Visible spectroscopy requires that the following conditions are met:All components of the mixture can be identified, and absorb within the wavelength range of the instrument.The absorbances of the components in the mixture follow Beer’s law.There is some degree of spectral difference between the components, the greater the similarity between the spectra of the individual components the more difficult the analysis.The spectrum of the mixture is the sum of components, i.e., the components must not interact to cause photometric or wavelength shifts.There should be no interaction between components and the solvent.Very large or very small absorbances should be avoided.There should be no absorbances in the analytical wavelength region due to impurities. If any of these assumptions do not hold, then the multi-component analysis is invalid
Slide10In this experiment, calculate concentrations in a Vitamin B group mixture consisting ofVitamin B1 (Thiamine HCl),Vitamin B2 (Riboflavin).Vitamin B6 (Pyridoxine HCl). Components may be determined from pure or mixed standards using whole scans, a selected scan range or selected wavelengths from the wavelength scans; derivatives (up to the 4th order) of the collected scan may also be used for component determination. Experimental:- Reagents/Materials Stock solutions of vitamins B1 (1000 mg/L), B2 (50 mg/L) and B6 (1000 mg/L) were prepared by dissolving weighed amounts in 100 mL of 1% hydrochloric acid, the stock solutions were used for preparing calibration standards and sample mixtures.Type ofSolutionVitamin B1(mg/L)Vitamin B2(mg/L)Vitamin B6(mg/L)Standard 110.00.0 0.0Standard 20.0 10.0
0.0
Standard 3
0.0
0.0
10.0
Sample 1
10.0
10.0
10.0
Sample 2
10. 0
10.0
1.0
Sample 3
10. 0
1.0
10.0
1Sample 41. 0 10.010.0
Table1
Standard and sample mixture concentrations
Slide11The reference standards that you prepare will be measured on the UV-Vis. spectroscopy and will give you the following spectra: At (λ)1 :- AB1(λ1) = εB1(λ1) b CB1S; AB6(λ1) = εB6(λ1) b CB6S; AB2(λ1) = εB2(λ1) b CB2S At (λ)2 :- AB1(λ2) = εB1(λ2) b CB1S; AB6(λ2) = εB6(λ2) b CB6S; AB2(λ2) = εB2(λ2) b CB2SAt (λ)3 :- AB1(λ3) = εB1(λ3) b CB1S; AB6(λ3) = εB6(λ3) b CB6S; AB2(λ3) = εB2(λ3) b CB2SThe three equations are taken from absorbances at three different wavelengths: λ1=245nm, λ2=266nm, & λ3=290nm for multi-vitamins mixture solution:- AM(245) = εB1(λ)1 b CB1+ εB2(λ)1 b CB2 + εB6(λ)1 b CB6AM(266) = εB1(λ)2 b CB1+ εB2(λ)2 b CB2 + εB6(λ)2 b CB6A
M
(
290
) = ε
B1(λ)3
b C
B1
+ ε
B2(λ)3
b C
B2
+ ε
B6(λ)3 b CB6Since ‘b’ is the same in all cases and = 1 cm A1 = εB1(λ)1 CB1+ εB2(λ)1 CB2 + εB6(λ)1 CB6A2 = εB1(λ)2 CB1+ εB2(λ)2 CB2 + εB6(λ)2 CB6A3 = εB1(λ)3 CB1+ εB2(λ)3 CB2 + εB6(λ)3 CB6
Slide12Slide13The spectra of the standards are shown in Figure1; all three components can be quantified, as there is a large degree of spectral difference between the components; Vitamin B2 is the only component that absorbs in the region 300 to 500 nm and has a strong absorption band at 266 nm; Vitamin B6 has a strong absorption band at 290 nm and Vitamin B1 has a strong absorption band at 245 nm:- Figure 2 shows the wavelength scans for samples 1 and 3 as representative examples; the multi-component analysis of the Vitamin B system was optimized by limiting the calculation range to between 225 nm and 500 nm; in the region above 500 nm there is no absorbance from any component, and in the region below 225 nm the spectra of the components have little structure; The results of the multi-component analysis using this reduced wavelength range are shown in Table3; the simplest way to validate the selected method of calculation is to re-measure the standards as samples and check the accuracy of results; as can be seen in Table3, the comparison of the calculated and expected results for the standards re-measured shows agreement to within 1.5%, thus validating the selected data collection and calculation parameters; the results in table3 for samples 1 to 4 show that the multi-component calculations are accurate for the chosen calculation parameters (compare with Table 1). For samples with relatively high concentrations of a component the calculated results are within 5% of the expected results. However, the % difference between the expected and calculated values increases slightly as the concentrations of individual components decreases. Generally, sample concentrations can be calculated to within 2–5%.
Slide14Experiment-7Determination of Caffeine and Acetylsalicylic Acid in an Analgesic Tablet by UV-Vis. Spectroscopy When an atom or molecule absorbs energy; electrons are promoted from their ground state to an excited state.
Slide15The total absorbance, At of a sample containing more than one component that can absorb the same wavelength is the sum of the individual absorbance, Ai :At = Σ Ai It is necessary that the absorptivity of the substances be different at various wavelengths but not necessary zero for one of the components. You will first determine the molar absorptivity ε of each component by constructing a calibration curve (absorbance vs. concentration) with standard solutions; then by measuring absorbance of the tablet solution at maximum absorption wavelength of both components, you will be able to figure out the amount of each component in the tablet.Preparation of solutionsCaffeine stock solution – Dissolve 0.024 g of caffeine in 50 mL volumetric flask with methanol and dilute to the mark. Acetylsalicylic acid (ASA) stock solution – Dissolve 0.024 g of ASA in 50 mL volumetric flask with methanol and dilute to the mark.Analgesic sample solution – Dissolve 0.06~0.09 g of an analgesic tablet or the content of an analgesic capsule with 20 mL of methanol in 50 mL volumetric flask with methanol and dilute to the mark. Make three sample solutions out of three tablets.
Slide16ProcedurePrepare working standards and sample from the stock solutions in the following manner:Standard no.Caffeine stock added (mL)ASA stock added (mL)Total volume (mL)Diluted w/ methanolASA1-0.550ASA2 -
1.0
50
ASA3
-
1.5
50
ASA4
-
2.0
50
ASA5
-
2.5
50
Caffeine1
0.5
-
50
Caffeine2
1.0
-
50
Caffeine3
1.5
-
50
Caffeine4
2.0
-
50
Caffeine5
2.5
-
50
Test
0.5
1.0
50
Sample1
2.5mL of sample solution 1
50
Sample2
2.5mL of sample solution 2
50
Sample3
2.5mL of sample solution 3
50
Slide17Run the spectra for ASA5 and Caffeine5; determine the wavelength of maximum absorbance (λmax) for each chemical.For each solution in the table, measure the absorbance at the two selected wavelengths.Data TreatmentTabulate the absorbance at the two selected wavelengths and concentration for the ASA and caffeine standard solutions.Plot absorbance vs. concentration (M) for both caffeine and ASA at the two selected wavelengths. Determine molar absorptivity for each component at those two wavelengths from the calibration curve.Calculate the expected absorbance for test at each wavelength and compare to that of the experimental values.Determine the weight percent of each component in the original analgesic tablets and report the standard deviation.Compare your result with the amount labeled on the bottle and report the precision of your results.